Prometheus in detail
- Prometheus is an open-source monitoring solution and time series database
- It was build by Soundcloud
- Has a very active developer and user community
- Now it’s a standalone open source project
- Prometheus joined the Cloud Native Computing Foundation in 2016
- It’s ideal for monitoring on premise as well as cloud workloads
- Prometheus provides Metrics and Alerting
Overview
| Introduction | Monitoring | Alerting | Internals | Use cases |
| What is Prometheus | Client Libraries | Introduction | Storage | – |
| Installing Prometheus and Grafana | Pushing metrics | Setting up alerts | Security | |
| Concepts | Querying | |||
| Configuration | Service Discovery | |||
| Monitoring nodes | Exporters | |||
| Architecture |
Objectives
- To be able to use Prometheus
- To get familiar with the Prometheus ecosystem
- To set up a monitoring platform using:
- Prometheus
- To create alerts in Prometheus
- To be able to query Prometheus data
Introduction
- In Prometheus we talk about Dimensional Data: time series are identified by metric name and a set of key/value pairs
| Metric name | Label | Sample |
| Temperature | location=outside | 90 |
- Prometheus includes a flexible query languaga
- Visualizations can be shown using a built-in expression browser or with integrations like Grafana
- It stores metrics in memory and on local disk in a custom, efficient format
- Prometheus is written in Go
- There are many client libraries and integrations available for Prometheus
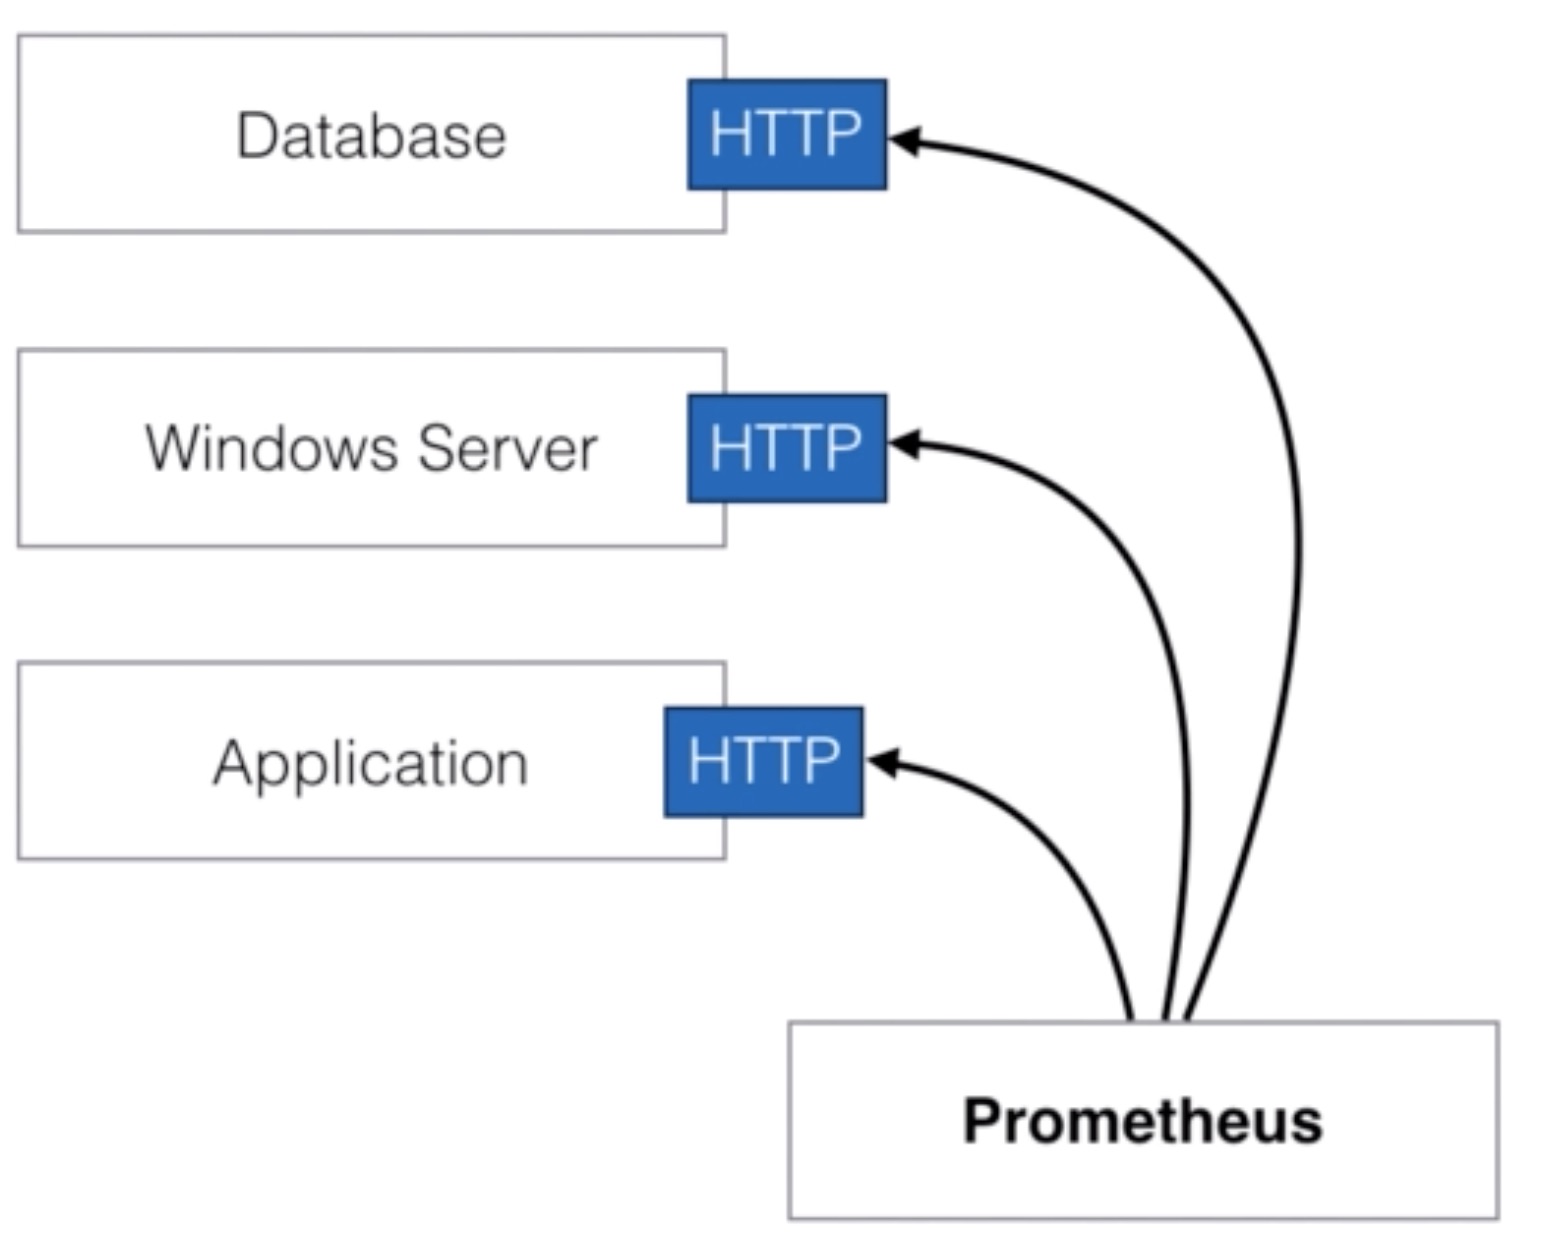
- Prometheus collects metrics from monitored targets by scraping metrics HTTP endpoints
- This is fundamentally different from other monitoring and alerting systems
- Rather than using custom scripts that check on particular services and systems, the monitoring data itself is used
- Scraping endpoints is much more efficient than other mechanisms like 3rd party agents
- A single Prometheus server is able to ingest up to one million samples per second as several million time series
Installation
- This is a VM / bare metal server installation, not running Prometheus in Kubernetes! Prometheus will be accessible via port 9090
PROMETHEUS_VERSION="2.6.0"
wget https://github.com/prometheus/prometheus/releases/download/v${PROMETHEUS_VERSION}/prometheus-${PROMETHEUS_VERSION}.linux-amd64.tar.gz
tar -xzvf prometheus-${PROMETHEUS_VERSION}.linux-amd64.tar.gz
cd prometheus-${PROMETHEUS_VERSION}.linux-amd64/
# if you just want to start prometheus as root
#./prometheus --config.file=prometheus.yml

# create user
useradd --no-create-home --shell /bin/false prometheus

# create directories
mkdir -p /etc/prometheus
mkdir -p /var/lib/prometheus

# set ownership
chown prometheus:prometheus /etc/prometheus
chown prometheus:prometheus /var/lib/prometheus

# copy binaries
cp prometheus /usr/local/bin/
cp promtool /usr/local/bin/

chown prometheus:prometheus /usr/local/bin/prometheus
chown prometheus:prometheus /usr/local/bin/promtool

# copy config
cp -r consoles /etc/prometheus
cp -r console_libraries /etc/prometheus
cp prometheus.yml /etc/prometheus/prometheus.yml

chown -R prometheus:prometheus /etc/prometheus/consoles
chown -R prometheus:prometheus /etc/prometheus/console_libraries

# setup systemd
echo '[Unit]
Description=Prometheus
Wants=network-online.target
After=network-online.target

[Service]
User=prometheus
Group=prometheus
Type=simple
ExecStart=/usr/local/bin/prometheus \
    --config.file /etc/prometheus/prometheus.yml \
    --storage.tsdb.path /var/lib/prometheus/ \
    --web.console.templates=/etc/prometheus/consoles \
    --web.console.libraries=/etc/prometheus/console_libraries

[Install]
WantedBy=multi-user.target' > /etc/systemd/system/prometheus.service

systemctl daemon-reload
systemctl enable prometheus
systemctl start prometheus
- Prometheus only provides basic visualization so we’ll install Grafana next
curl -s https://packagecloud.io/install/repositories/grafana/stable/script.rpm.sh | sudo bash
systemctl daemon-reload
systemctl start grafana-server
systemctl enable grafana-server.service
- Grafana will be accessible on port :3000 per default
- Add a datasource for Prometheus to Grafana
Basic concepts
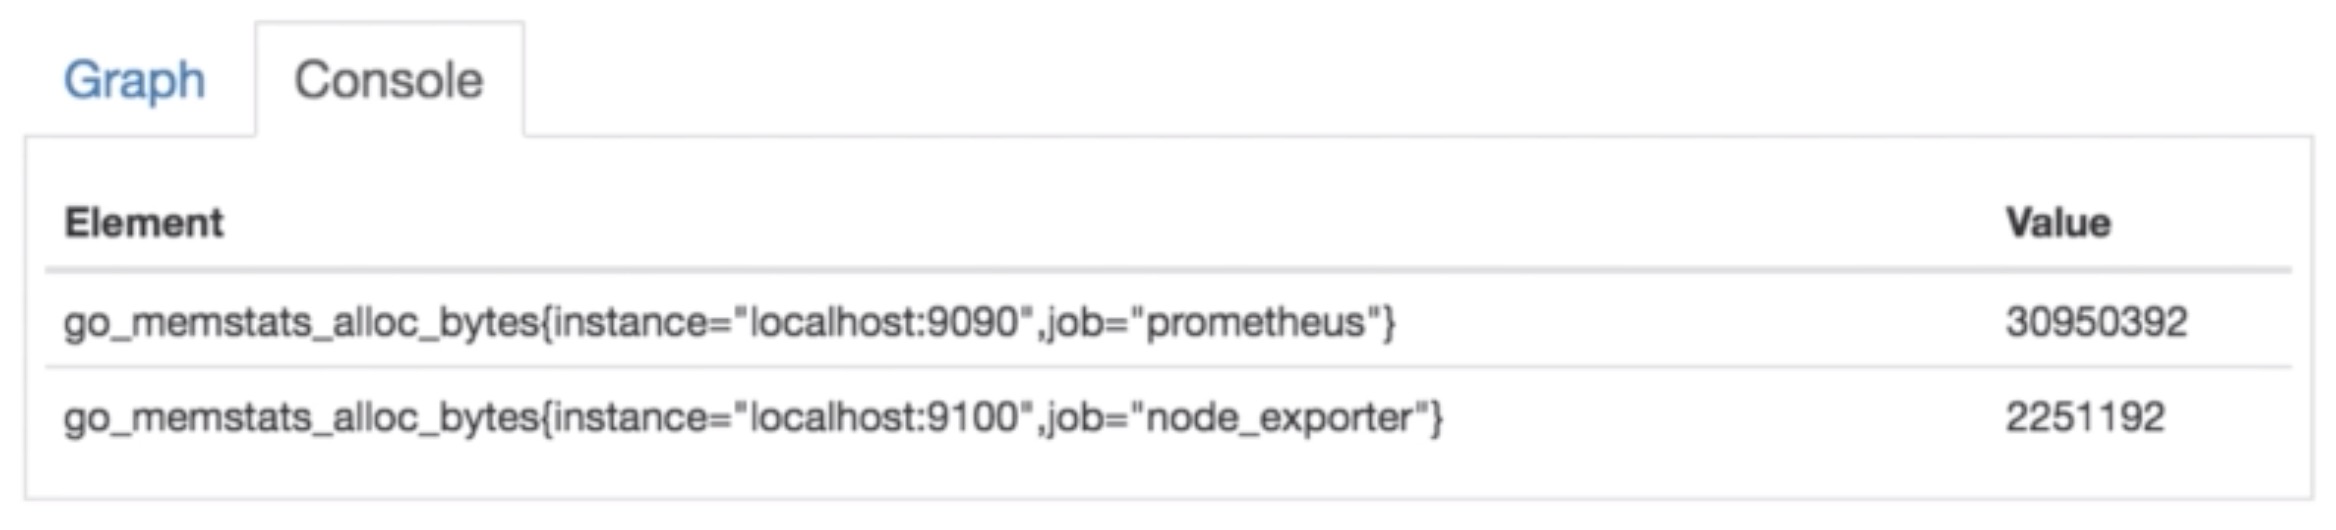
- All data is stored as time series
- Every time series is identified by the “metric name” and a set of key-value pairs, called labels
- metric: go_memstat_alloc_bytes
- instance=localhost:9090
- job=prometheus
- metric: go_memstat_alloc_bytes
- Every time series is identified by the “metric name” and a set of key-value pairs, called labels

- The time series data also consists of the actual data, called Samples:
- It can be a float64 value
- or a millisecond-precision timestamp
- The notation of time series is often using this one:
- <metric name>{<label name>=<label value>, …}
- For example:
- node_boot_time{instance=”localhost:9100”,job=”node_exporter”}}
Configuration
- Prometheus configuration is stored in yaml format
- The configuration file can be changed and applied without having to restart Prometheus
- A reload can be done by executing kill -SIGHUP <pid>
- The configuration file can be changed and applied without having to restart Prometheus
- You can also pass parameters (flags) at startup time to prometheus
- Those parameters cannot be changed without restarting Prometheus
- The configuration file is passed using the flag –config-file
- The default configuration file looks like this:
# my global config
global:
  scrape_interval:      15s # set the scrape interval to every 15 seconds. Default is every minute
  evaluation_interval:  15s # Evaluate rules every 15 seconds. The default is every minute
  # scrape_timeout is set to the global default (10s)

# Alertmanager configuration
alerting:
  alertmanagers:
  - static_configs:
    - targets:
      # - alertmanager:9093

# Load rules once and periodically evaluate them according to the global 'evaluation_interval'
rule_files:
  # - "first_rules.yml"
  # - "second_rules.yml"
- To scrape metrics you need to add configuration for it to the Prometheus config file
- For example, to scrape metrics from Prometheus itself, the following code block is added to the configuration by default
# A scrape configuration containing exactly one endpoint to scrape:
# In this case it's Prometheus itself.
scrape_configs:
  # The job name is added as a label ''job=<job_name>' to any timeseries scraped from this config
  - job_name: 'prometheus'
  # metrics_path defaults to '/metrics'
  # scheme defaults to 'http'
    static_configs:
      - targets: ['localhost:9090']
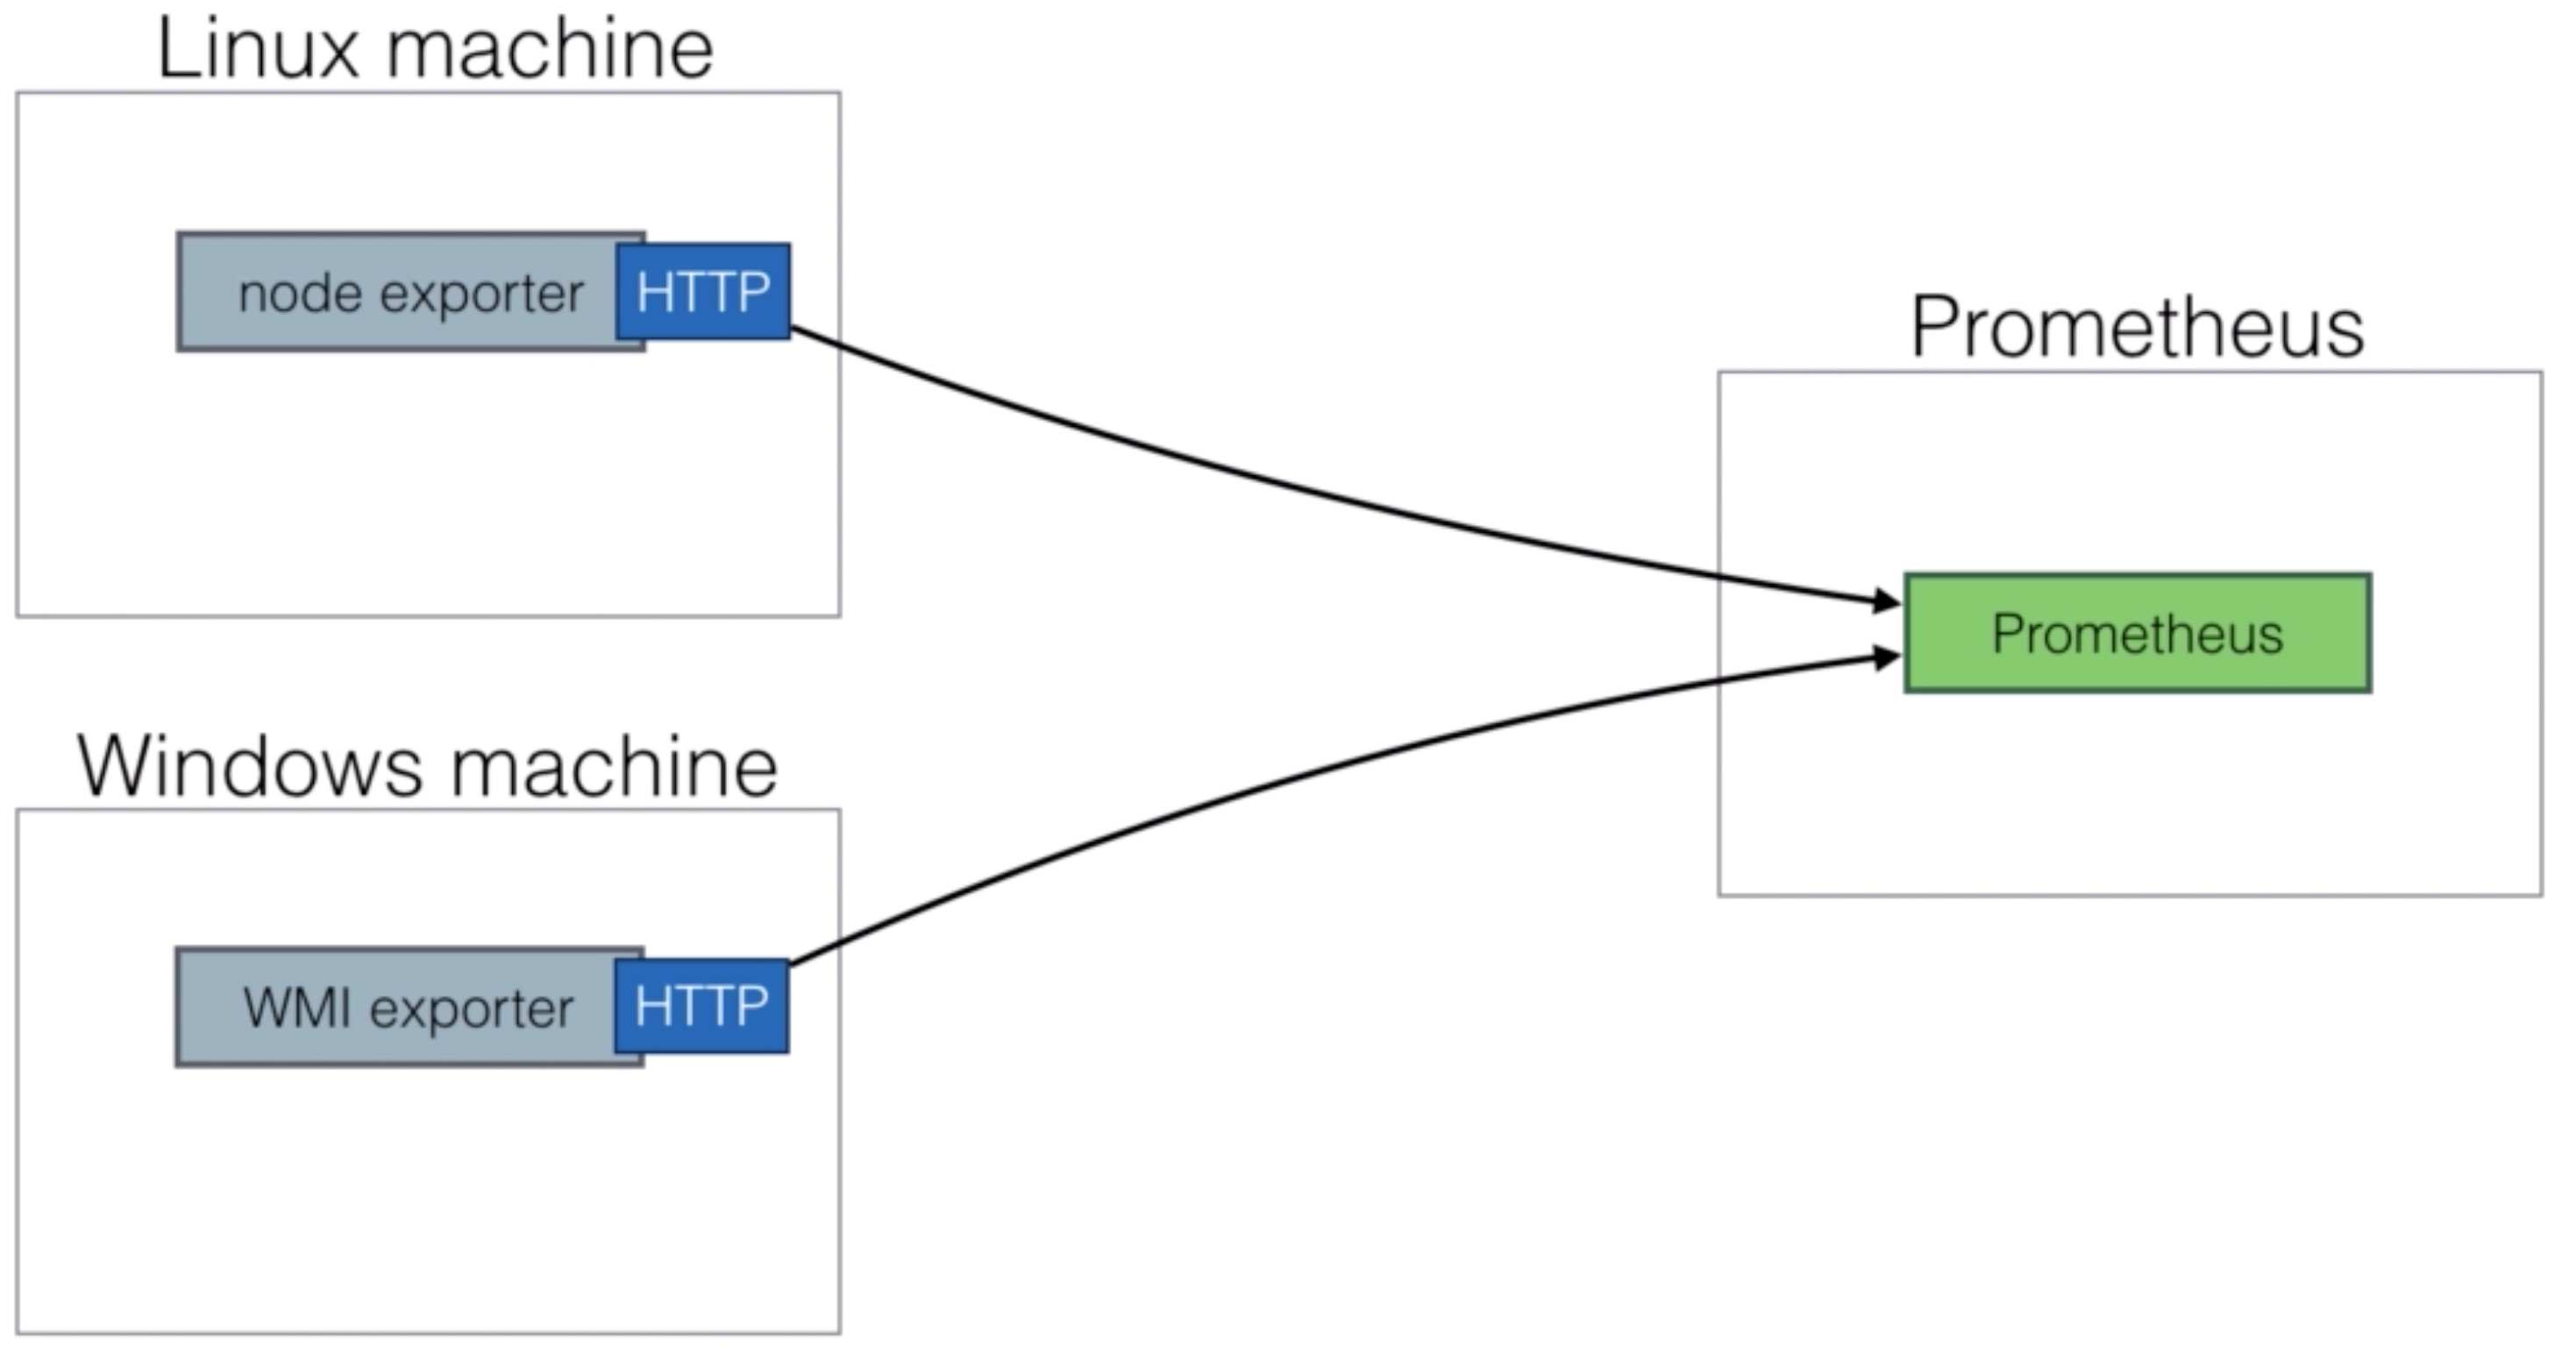
- To monitor nodes, you need to install the node-exporter
- The node-exporter will expose machine metrics of Linux / Unix machines
- For example: cpu usage, memory usage
- The node-exporter can be used to monitor machines and later on you can create alerts based on these ingested metrics
- For Windows there’s a WMI exporter (see https://github.com/martinlindhe/wmi_exporter)
Install node-exporter
- The node-exporter needs to be installed on every node you want to monitor. It’ll expose the required path on port 9100 for Prometheus to scrape. Of course you’ll need to allow connection through firewall if any.
NODE_EXPORTER_VERSION="0.17.0"
wget https://github.com/prometheus/node_exporter/releases/download/v${NODE_EXPORTER_VERSION}/node_exporter-${NODE_EXPORTER_VERSION}.linux-amd64.tar.gz
tar -xzvf node_exporter-${NODE_EXPORTER_VERSION}.linux-amd64.tar.gz
cd node_exporter-${NODE_EXPORTER_VERSION}.linux-amd64
cp node_exporter /usr/local/bin

# create user
useradd --no-create-home --shell /bin/false node_exporter

chown node_exporter:node_exporter /usr/local/bin/node_exporter

echo '[Unit]
Description=Node Exporter
Wants=network-online.target
After=network-online.target

[Service]
User=node_exporter
Group=node_exporter
Type=simple
ExecStart=/usr/local/bin/node_exporter

[Install]
WantedBy=multi-user.target' > /etc/systemd/system/node_exporter.service

# enable node_exporter in systemctl
systemctl daemon-reload
systemctl start node_exporter
systemctl enable node_exporter


echo "Setup complete.
Add the following lines to /etc/prometheus/prometheus.yml:

  - job_name: 'node_exporter'
    scrape_interval: 5s
    static_configs:
      - targets: ['localhost:9100']
"
- Don’t forget to reload Prometheus after adding the scrape configuration for the node-exporter
Prometheus Architecture

Prometheus Monitoring
How to use Client Libraries (Python, Go, …)
- Instrumenting your code
- Libraries
- Official: Go, Java/Scala, Python, Ruby
- Unofficial: Bash, C++, Common Lisp, Elixir, Erlang, Hskell, Lua for Nginx, Lua for Tarantool, .NET / C#, Node.js, PHP, Rust
- No client library available?
- Implement it yourself in one of the supported exposition formats
- Simple text-based format
- Protocol-buffer format (Prometheus 2.0 removed support for the protocol-buffer format)
- Implement it yourself in one of the supported exposition formats
metric_name [
    "{" label_name "=" `"` label_value `"` { "," label_name "=" `=` label_value `"` } [ "," ] "}"
] value [ timestamp ]

node_filesystem_avail_bytes{device="/dev/sda1",fstype="ext4"mountpoint="/"} 4.9386491904e+10
There are 4 types of metrics
Counter
- A value that only goes up (e.g. visits to a website)
Gauge
- Single numeric value that can go up and down (e.g. CPU load, temperature, …)
Histogram
- Samples observations (e.g. request durations or response sized) and these observations get counted into buckets. Includes (_count and _sum). Main purpose is calculating quantities
Summary
Similar to a histogram, a summary samples observations (e.g. request durations or response sizes). A summary also provides a total count of observations and a sum of all observed values. It calculates configurable quantiles over a sliding time window.
Example: you need 2 counters for calculating the latency 1. total request (_count) 2. the total latency of those requests (_sum)
Take the rate() and divide = average latency
Python example
- https://github.com/prometheus/client_python
- Officially supported language
pip install prometheus_client- Supported metrics: Counter, Gauge, Summary and Histogram
import random, time

from flask import Flask, render_template_string, abort
from prometheus_client import generate_latest, REGISTRY, Counter, Gauge, Histogram

app = Flask(__name__)

REQUESTS = Counter('http_requests_total', 'Total HTTP Requests (count)', ['method', 'endpoint', 'status_code'])
IN_PROGRESS = Gauge('http_requests_inprogress', 'Number of in progress HTTP requests')
TIMINGS = Histogram('http_request_duration_seconds', 'HTTP request latency (seconds))

@app.route('/')
@TIMINGS.time()
@IN_PROGRESS.track_inprogress()
def hello_world():
    REQUESTS.labels(method='GET', endpoint="/", status_code=200).inc() # Increment the counter
    return 'Hello, World!'

@app.route('/prometheus-course/<name>')
@IN_PROGRESS.track_inprogress()
@TIMINGS.time()
def index(name):
    REQUESTS.labels(method='GET', endpoint="/prometheus-course/<name>", status_code=200).inc()
    return render_template_string('<b>Hello {{name}} welcome!</b>!', name=name)

@app.route('/metrics')
@IN_PROGRESS.track_inprogress()
@TIMINGS.time()
def metrics():
    REQUESTS.labels(method='GET', endpoint="/metrics", status_code=200).inc()
    return generate_latest(REGISTRY)

if __name__ == "__main__":
    app.run(host='0.0.0.0')
Go example
- https://github.com/prometheus/client_golang
- Officially supported language
- Easy to implement
- Supported metrics: Counter, Gauge, Summary and Histogram
package main

import (
    "github.com/prometheus/client_golang/prometheus/promhttp"
    "net/http"
)

func main() {
    http.Handle("/metrics", promhttp.Handler())
    panic(http.ListenAndServe(":8080", nil))
}
- Gauge
import "github.com/prometheus/client_golang/prometheus"

var jobsInQueue = prometheus.NewGauge(
    prometheus.GaugeOpts{
        Name: "jobs_queued",
        Help: "Current number of jobs queues",
    },
)

func init() {
    prometheus.MustRegister(jobsQueued)
}

func enqueueJob(job Job) {
    queue.Add(job)
    jobsInQueue.Inc()
}

func runNextJob() {
    job := queue.Dequeue()
    jobsInQueue.Dec()

    job.Run()
}
- Adding labels
import "github.com/prometheus/client_golang/prometheus"

var jobsInQueue = prometheus.NewGaugeVec(
    prometheus.GaugeOpts{
        Name: "jobs_queued",
        Help: "Current number of jobs queues",
    },
    []string{"job_type"},
)

func init() {
    prometheus.MustRegister(jobsQueued)
}

func enqueueJob(job Job) {
    queue.Add(job)
    jobsInQueue.WithLabelValues(job.Type()).Inc()
}

func runNextJob() {
    job := queue.Dequeue()
    jobsInQueue.WithLabelValues(job.Type()).Dec()

    job.Run()
}
- If you’re specifying multiple labels then the order is important. The label values must be passed in the same order as they were defined, otherwise the metrics get mixed up
- Histogram
import "github.com/prometheus/client_golang/prometheus"

var jobsDurationHistrogram = prometheus.NewHistogramVec(
    prometheus.HistogramOpts{
        Name: "jobs_duration_seconds",
        Help: "Jobs duration distribution",
        Buckets: []float64{1, 2, 5, 10, 20, 60},
    },
    []string{"job_type"},
)

start := time.Now()
job.Run()
duration := time.Since(start)
jobsDurationHistogram.WithLabelValues(job.Type()).Observe(duration.Seconds())
- Process duration within an application can be a good indicator of performance of that application and to identify any bottlenecks.
- Summary
Is similar to th Histogram with the difference that you’ll need to indicate which quantiles to take into account.
[...]
prometheus.NewSummary()
Pushing metrics
- Prometheus by default prefers a pull based metrics collection.
- Pushgateway is used as an intermediary service which allows you to push metrics.
- https://github.com/prometheus/pushgateway

- Pitfalls
- Most of the times this is a single instance so this results in a SPOF
- Prometheus’s automatic instance health monitoring is not possible
- The Pushgateway never forgets the metrics unless they are deleted via the API
curl -X DELETE http://localhost:9091/metrics/job/prom_course/instance/localhost
- Only one valid use case for the Pushgateway
- Service level batch jobs and not related to a specific machine
- If NAT and/or firewall is blocking you from using the pull mechanism
- Move the Prometheus server to the same network
Python example
from prometheus_client import CollectorRegistry, Gauge, push_to_gateway

registry = CollectorRegistry()
g = Gauge('job_last_success_unixtime', 'Last time the course batch job has finished', registry=registry)
g.set_to_current_time()
push_to_gateway('localhost:9091', job='batchA', registry=registry)
- Pushgateway functions take a grouping key.
- push_to_gateway replaces metrics with the same grouping key
- pushadd_to_gateway only replaces metrics with teh same name and grouping key
- delete_from_gateway deletes metrics with the given job and grouping key
Go example
package main
import (
    "flag"
    "log"
    "net/http"
    "github.com/prometheus/client_golang/prometheus/promhttp"
    "github.com/prometheus/client_golang/prometheus/push"
)

gatewayUrl := "http://localhost:9091"

throughputGauge := prometheus.NewGauge(prometheus.GaugeOpts{
    Name: "throughput",
    Help: "Throughput in Mbps",
    }
)

throughputGauge.Set(800)

if err := push.Collectors(
    "throughput_job", push.HostnameGroupingKey(),
    gatewayUrl, throughputGauge
    ); err != nil {
        fmt.Println("Could not push completion time to Pushgateway:", err)
}
Querying
- Prometheus provides a functional expression language called PromQL
- Provides built in operators and functions
- Vector based calculations like Excel
- Expressions over time series vectors
- PromQL is read-only
- Example:
100 - (avg by (instance) (irate(node_cpu_sconds_total{job='node_exporter',mode="idle"}[5m])) * 100 )
Expressions
- Instant vector - a set of time series containing a single sample for each time series, all sharing the same timestamp
Example:
node_cpu_seconds_total - Range vector - a set of time series containing a range of data points over time for each time series
Example:
node_cpu_seconds_total[5m] - Scalar - a simple numeric floating point value
Example:
-3.24 - String - a simple string value; currently unused
Example:
foobar
Operators
- Arithmetic binary operators Example: - (substraction), * (multiplication), / (division), % (modulo), ^ (power/exponentiation)
- Comparison binary operators Example: == (equal), != (not equal), > (greater than), < (less than), >= (greater or equal), <= (less or equal)
- Logical/set binary operators Example: and (intersection), or (union), unless (complement)
- Aggregation operators Example: sum (calculate sum over dimensions), min (select minimum over dimensions), max (select maximum over dimensions), avg (calculate the average over dimensions), stddev (calculate population standard deviation over dimensions), stdvar (calculate population standard variance over dimensions), count (count number of elements in the vector), count_values (count number of elements with the same value), bottomk (smallest k elements by sample value), topk (largest k elements by sample value), quantile (calculate over dimentions)
Service discovery
- Service discovery is the automatic detection of devices and services offered by these devices on a computer network
- Not really a service discovery mechanism if you have to manually update your configs
static_configs:
  - targets: ['localhost:9090']
- Cloud support for AWS, Azure, Google, …
- Cluster manager (Kubernetes, Marathon, …)
- Generic mechanisms (DNS, Consul, Zookeeper, …)
Example on AWS
- EC2 Example:
Add following config to your
prometheus.yml
global:
  scrape_interval: 1s
  evaluation_interval: 1s

scrape_configs:
  - job_name: 'node'
    ec2_sd_configs:
      - region: <your region>
        access_key: <your access key>
        secret_key: <your secret key>
        port: 9100
- Make sure the user has the following IAM role: AmazonEC2ReadOnlyAccess
- Make sure your security groups allow access to port 9100, 9090.
- EC2 Example: Only monitor instances started with the name PROD
global:
  scrape_interval: 1s
  evaluation_interval: 1s

scrape_configs:
  - job_name: 'node'
    ec2_sd_configs:
      - region: <your region>
        access_key: <your access key>
        secret_key: <your secret key>
        port: 9100
    relabel_configs:
        # Only monitor instances with the tag Name starting with "PROD"
      - source_labels: [__meta_ec2_tag_Name]
        regex: PROD.*
        action: keep
        # Use the instance ID as the instance label
      - source_labels: [__meta_ec2_instance_id]
        target_label: instance
Example on Kubernetes
- Add following config to your
prometheus.ymlfile
- job_name: 'kubernetes'
  kubernetes_sd_configs:
    -
      api_servers:
        - https://kubernetes.default.svc
      in_cluster: true
      basic_auth:
        username: prometheus
        password: secret
      retry_interval: 5s

- job_name: 'kubernetes-service-endpoints'
  kubernetes_sd_configs:
    -
      api_servers:
        - https://kube-master.prometheuscourse.com
      in_cluster: true
Example on DNS
- Add following config to your
prometheus.ymlfile
- job_name: mysql
  dns_sd_configs:
    - names:
      - metrics.mysql.example.com
- job_name: haproxy
  dns_sd_configs:
    - names:
      - metrics.haproxy.example.com
Example on files
- Add following config to your
prometheus.ymlfile
scrape_configs:
  - job_name: 'dummy' # This is the default value, it's mandatory
    file_sd_configs:
      - files:
        - targets.json
targets.json
[
  {
    "targets": [ "myslave1:9104", "myslave2:9104" ],
    "labels": {
      "env": "prod",
      "job": "mysql_slave"
    }
  },
  {
    "targets": [ "mymaster:9104" ],
    "labels": {
      "env": "prod",
      "job": "mysql_master"
    }
  }
]
Exporters
- Build for exporting Prometheus metrics from existing third-party metrics
- When Prometheus is not able to pull metrics directly (Linux sys stats, haproxy, …)
- Examples: MySQL server exporter Memcached exporter Consul exporter Node/system metrics exporter MongoDB Redis Many more….
- https://prometheus.io/docs/instrumenting/exporters/
- Configure an exporter in the
prometheus.ymlfile (like the node exporter for example)
- job_name: 'node_exporter'
  scrape_interval: 5s
  static_configs:
    - targets: ['localhost:9100']
Alerting
- Automated alerts are essential to monitoring
- Alerting in Prometheus is divided into two parts
- Alerting rules in Prometheus server
- Alertmanager

Alerting rules
- Rules live in Prometheus server configuration
- Best practice is to separate the alerts from the Prometheus configuration file
- Add an include in
prometheus.yml
- Add an include in
rule_files:
- "/path/to/yourfile/alert.rules"
- Alert format:
ALERT <alert name>
  IF <expression>
  [ FOR <duration> ]
  [ LABELS <label set> ]
  [ ANNOTATIONS <label set> ]
- Alert example
groups:
- name: example
  rules:
  - alert: cpuUsage
    expr: 100 - (avg by (instance) (irate(node_cpu_seconds_total{job="node_exporter',mode="idle"}[5m])) * 100) > 95
    for: 1m
    labels:
      severity: critical
    annotations:
      summary: Machine under heavy load
- Alerting rules allow you to define the alert conditions
- Alerting rules send the alerts being fired to an external service
- The format of these alerts is in the Prometheus expression language
- Example:
groups:
- name: Important instance
  rules:

  # Alert for any instance that is unreachable for > 5 min
  - alert: InstanceDown
    expr: up ==0
    for: 5m
    labels:
      severity: page
    annotations:
      summary: "Instance {{ $labels.instance }} down"
      description: "{{ $labels.instance }} of job {{ $labels.job }} has been down for more than 5 minutes."
Alertmanager
- Alertmanager handles the alerts fired by the Prometheus server
- Handles deduplication, grouping and routing of alerts
- Routes alerts to receivers (Pagerduty, Opsgenie, email, Slack, …)
- Alertmanager configuration lives in
/etc/alertmanager/alertmanager.yml
global:
  smtp_smarthost: 'localhost:25'
  smtp_from: 'alertmanager@prometheus.com'
  smtp_auth_username: ''
  smtp_auth_password: ''

templates:
- '/etc/alertmanager/template/*.tmpl'

route:
  repeat_interval: 1h
  receiver: operations-team

receivers:
- name: 'operations-team'
  email_configs:
  - to: 'operations-team+alerts@example.org'
- In order for Alertmanager to work you’ll need to configure it in
prometheus.yml
global:
  scrape_interval:     15s
  evaluation_interval: 15s
[...]

# Alertmanager configuration
alerting:
  alertmanagers:
  - static_configs:
    - targets:
      - localhost:9093

[...]
Concepts
- Grouping: groups similar alerts into 1 notification
- Inhibition: silence other alerts if one specified alert is already fired
- Silences: a simple way to mute certain notifications
- High availability
- You can create a high available Alertmanager cluster using mesh config
- Do not load balance this service!
- Use a list of Alertmanager nodes in
prometheus.yml
- Use a list of Alertmanager nodes in
- All alerts are sent to all known Alertmanager nodes
- No need to monitor the monitor
- Guarantees that the notification is at least send once
Alert states
- Inactive - No rule is met
- Pending - Rule is met but can be suppressed due to validations
- Firing - Alert is sent to the configured channel (mail, Slack, …)
- Alertmanager runs on port 9093
Notifying multiple destinations
route:
  repeat_interval: 1h
  receiver: operations-team

receivers:
- name: 'operations-team'
  email_configs:
  - to: 'operations-team+alerts@example.org'
  slack_configs:
  - api_url: https://hooks.slack.com/services/XXXXX/XXXXX/XXXXX
    channel: '#prometheus-course'
    send_resolved: true
Installation of Alertmanager
- Overview
- Install Alertmanager
- Create configuration for Alertmanager
- Slack
- Alter Prometheus configuration to include Alertmanager
- Set up an alert
- See the notification come in when an alert is fired
install-alertmanager.sh
ALERTMANAGER_VERSION="0.15.3"
wget https://github.com/prometheus/alertmanager/releases/download/v${ALERTMANAGER_VERSION}/alertmanager-${ALERTMANAGER_VERSION}.linux-amd64.tar.gz
tar xvzf alertmanager-${ALERTMANAGER_VERSION}.linux-amd64.tar.gz
cd alertmanager-${ALERTMANAGER_VERSION}.linux-amd64/
# if you just want to start prometheus as root
#./alertmanager --config.file=simple.yml

# create user
useradd --no-create-home --shell /bin/false alertmanager

# create directories
mkdir /etc/alertmanager
mkdir /etc/alertmanager/template
mkdir -p /var/lib/alertmanager/data

# touch config file
touch /etc/alertmanager/alertmanager.yml

# set ownership
chown -R alertmanager:alertmanager /etc/alertmanager
chown -R alertmanager:alertmanager /var/lib/alertmanager

# copy binaries
cp alertmanager /usr/local/bin/
cp amtool /usr/local/bin/

# set ownership
chown alertmanager:alertmanager /usr/local/bin/alertmanager
chown alertmanager:alertmanager /usr/local/bin/amtool

# setup systemd
echo '[Unit]
Description=Prometheus Alertmanager Service
Wants=network-online.target
After=network.target

[Service]
User=alertmanager
Group=alertmanager
Type=simple
ExecStart=/usr/local/bin/alertmanager \
    --config.file /etc/alertmanager/alertmanager.yml \
    --storage.path /var/lib/alertmanager/data
Restart=always

[Install]
WantedBy=multi-user.target' > /etc/systemd/system/alertmanager.service

systemctl daemon-reload
systemctl enable alertmanager
systemctl start alertmanager

# restart prometheus
systemctl start prometheus
/etc/alertmanager/alertmanager.yml
# Substitute values where required
global:
  smtp_smarthost: 'localhost:25'
  smtp_from: 'alertmanager@prometheus.com'
  smtp_auth_username: ''
  smtp_auth_password: ''
  smtp_require_tls: false

templates:
- '/etc/alertmanager/template/*.tmpl'

route:
  repeat_interval: 1h
  receiver: operations-team

receivers:
- name: 'operations-team'
  email_configs:
  - to: 'operations-team+alerts@example.org'
  slack_configs:
  - api_url: https://hooks.slack.com/services/XXXXXX/XXXXXX/XXXXXX
    channel: '#prometheus-course'
    send_resolved: true
/etc/prometheus/prometheus.yml
# Alter the following config in /etc/prometheus/prometheus.yml:

alerting:
  alertmanagers:
  - static_configs:
    - targets:
      - localhost:9093"
- You’ll need access to a mailserver or a relay to send mails of course.
Storage
- You can use the default local on-disk storage or optionally the remote storage system
- Local storage is a local time series database in a custom Prometheus format
- Remote storage allows you to read/write samples to a remote system in a standardized format
- Currently it uses a snappy-compressed protocol buffer encoding over HTTP, but that might change in the future to use gRPC or HTTP/2
- Remote storage is primarily focused on long term storage
- Currently there are adapters available for the following solutions:
| AppOptics: write | Graphite: write |
| Chronix: write | InfluxDB: read and write |
| Cortex: read and write | OpenTSDB: write |
| CrateDB: read and write | PostgreSQL/TimescaleDB: read and write |
| Gnocchi: write | SignalFx: write |
- We’ll focus on local storage to explain how data from Prometheus is stored
- Prometheus >= 2.0 uses a new storage engine which dramatically increases scalability
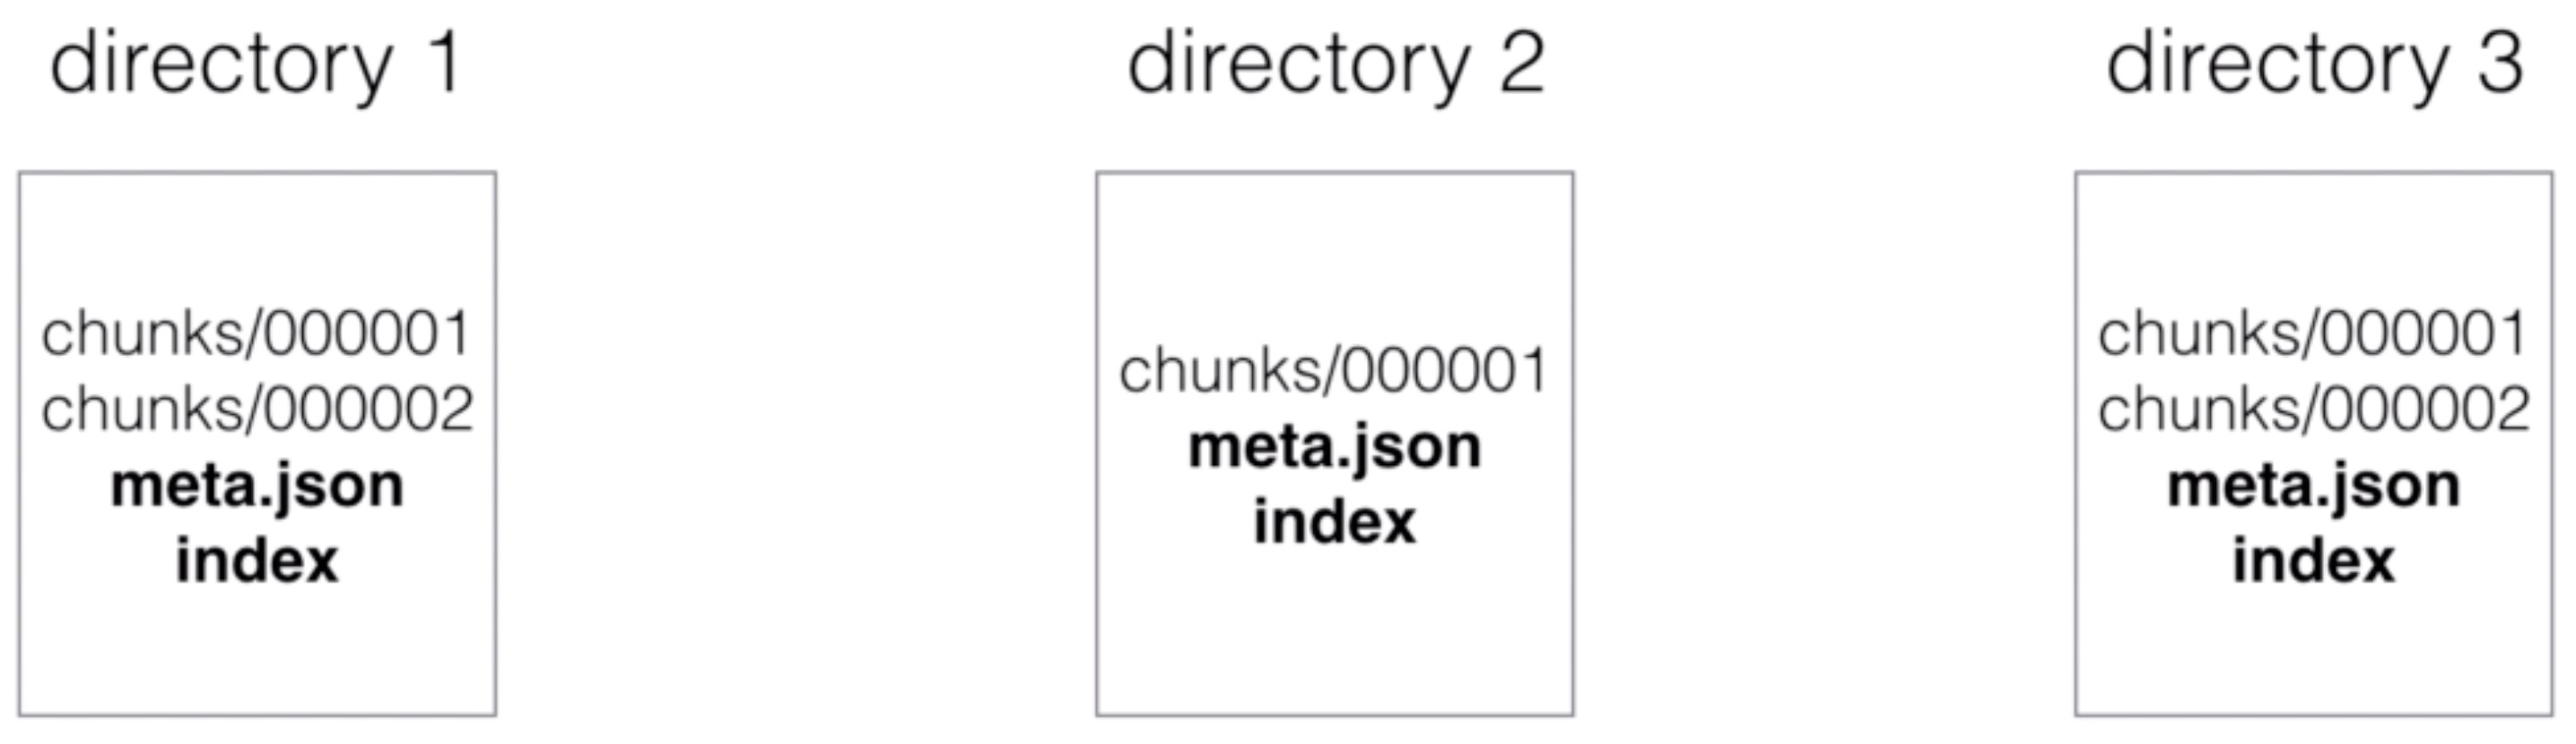
- Ingested samples are grouped in blocks of two hours
- Those 2 h samples are stored in separate directories in the data directory of Prometheus
- Writes are batched and written to disk in chunks containing multiple data points
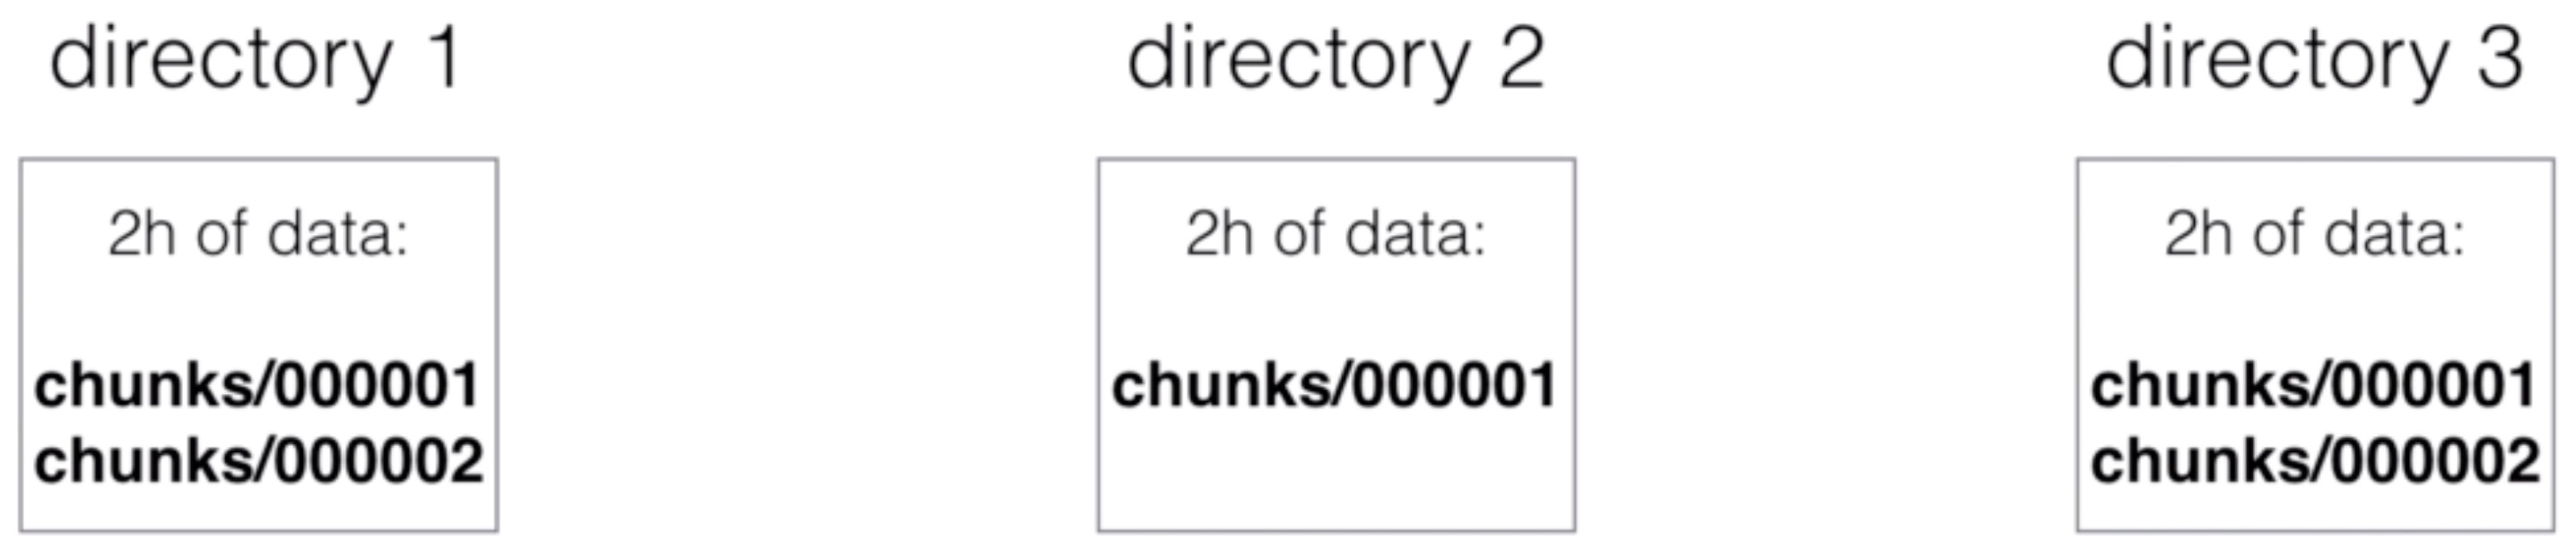
- Every directory also has an index file (index) and a metadata file (meta.json)
- It stores the metric names and the labels and provides an index from the metric names and labels to the series in the chunk files
- The most recent data is kept in memory
- You don’t want to loose the in memory data during a crash so the data also needs to be persisted to disk. This is done using a write-ahead-log (WAL)
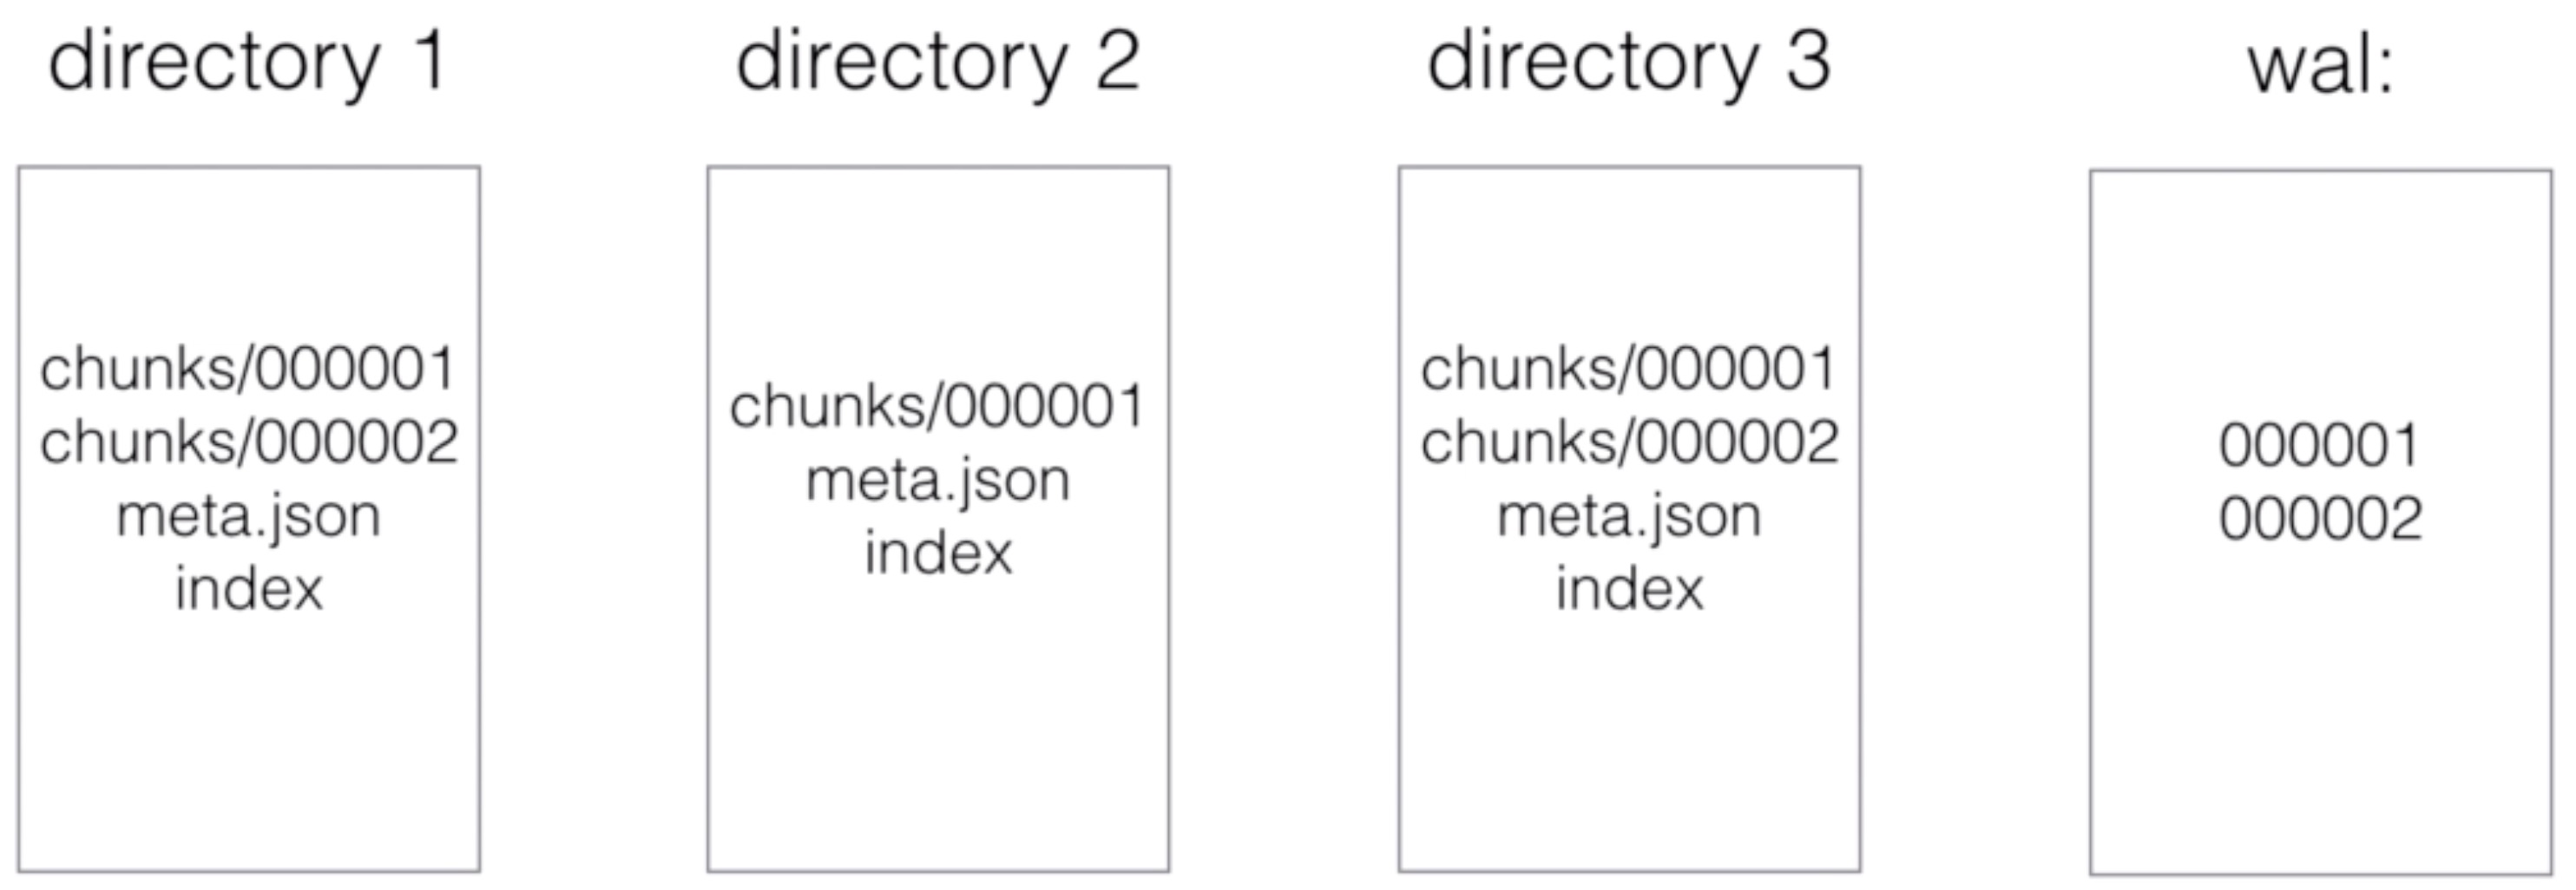
Write Ahead Log (WAL)
- It’s quicker to append to a file (like a log) than o make (multiple) random read/writes
- If there’s a server crash and the data from memory is lost, then the WAL will be replayed
- This way, no data will be lost or corrupted during a crash
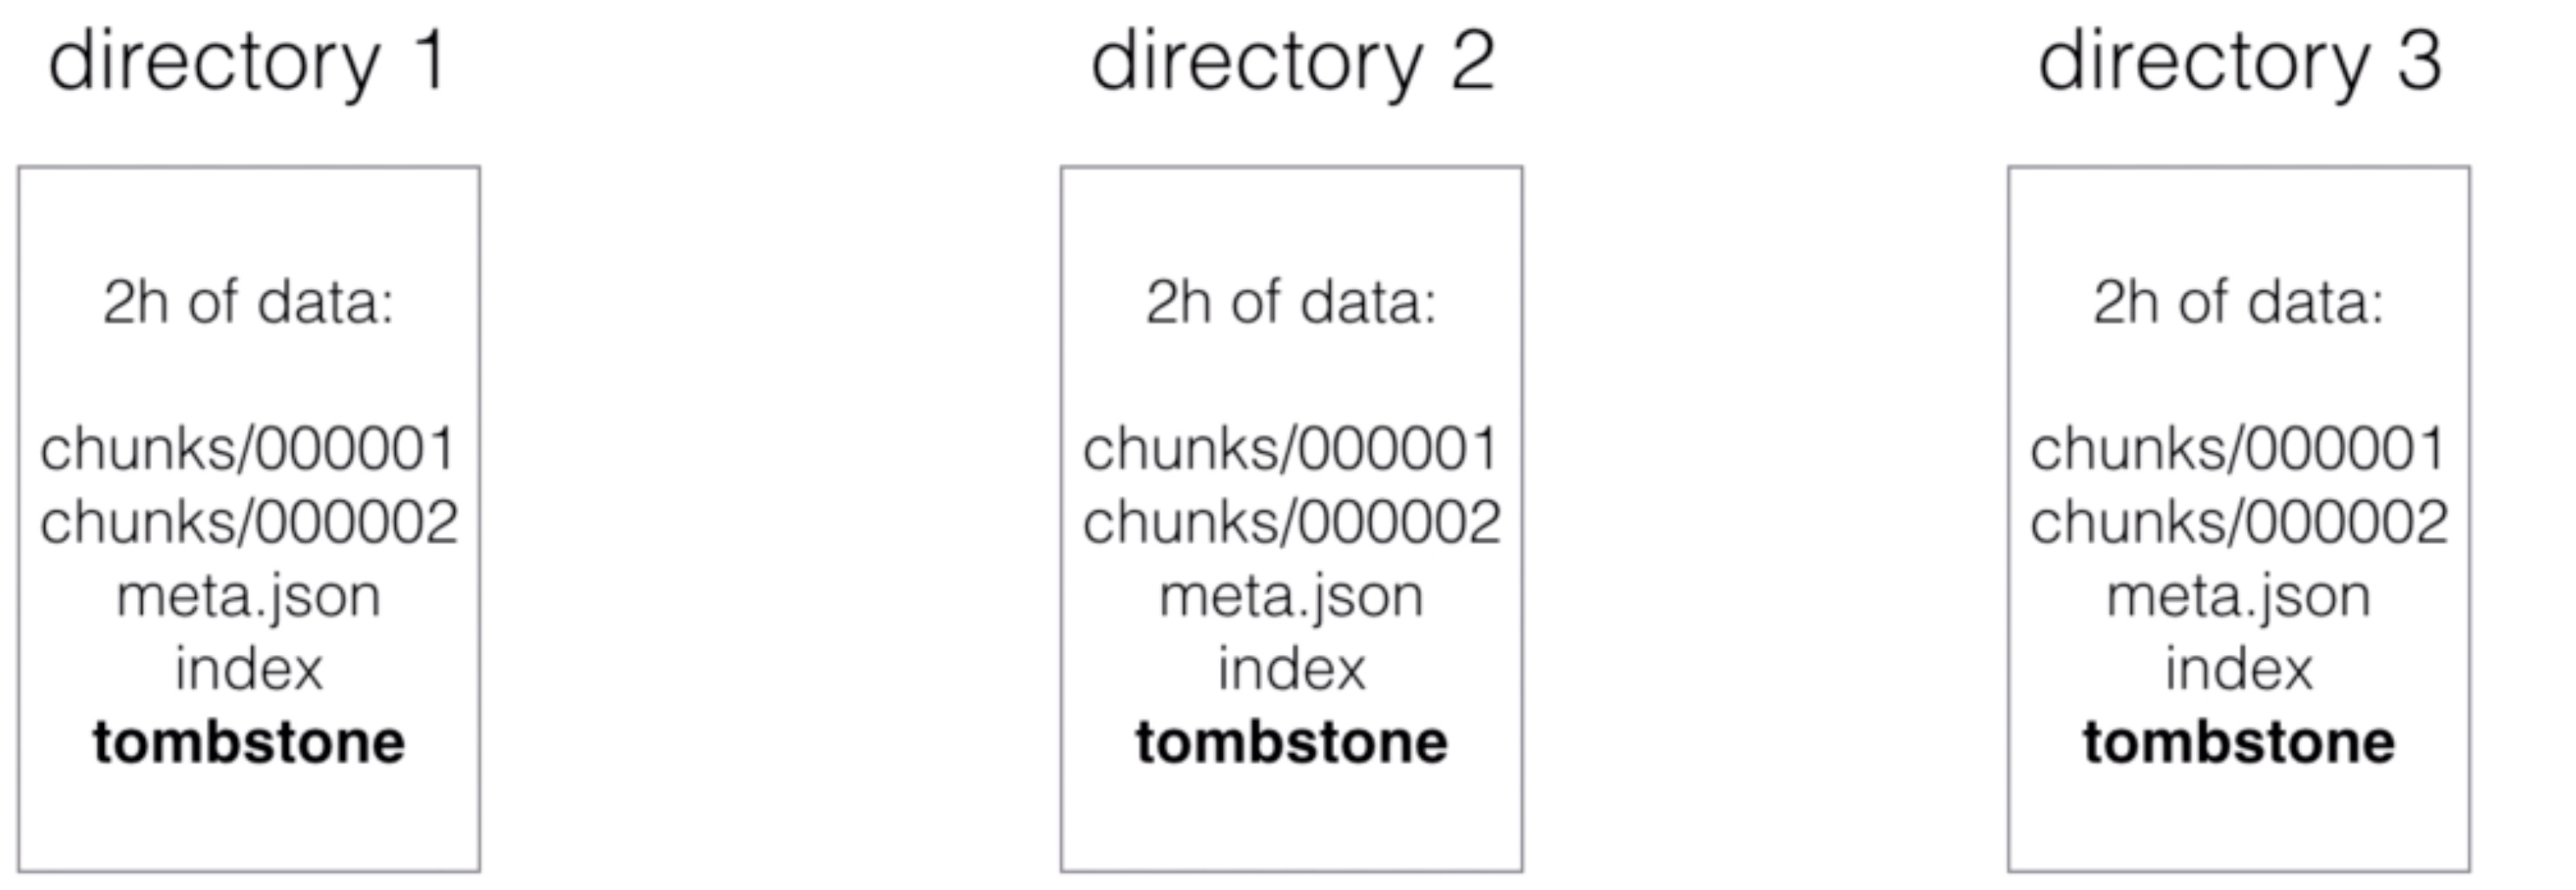
- When series get deleted, a tombstone file gets created
- This is more efficient than immediately deleting the data from the chunk files, as the actual delete can happen at a later time (e.g. when there’s not a lot of load)
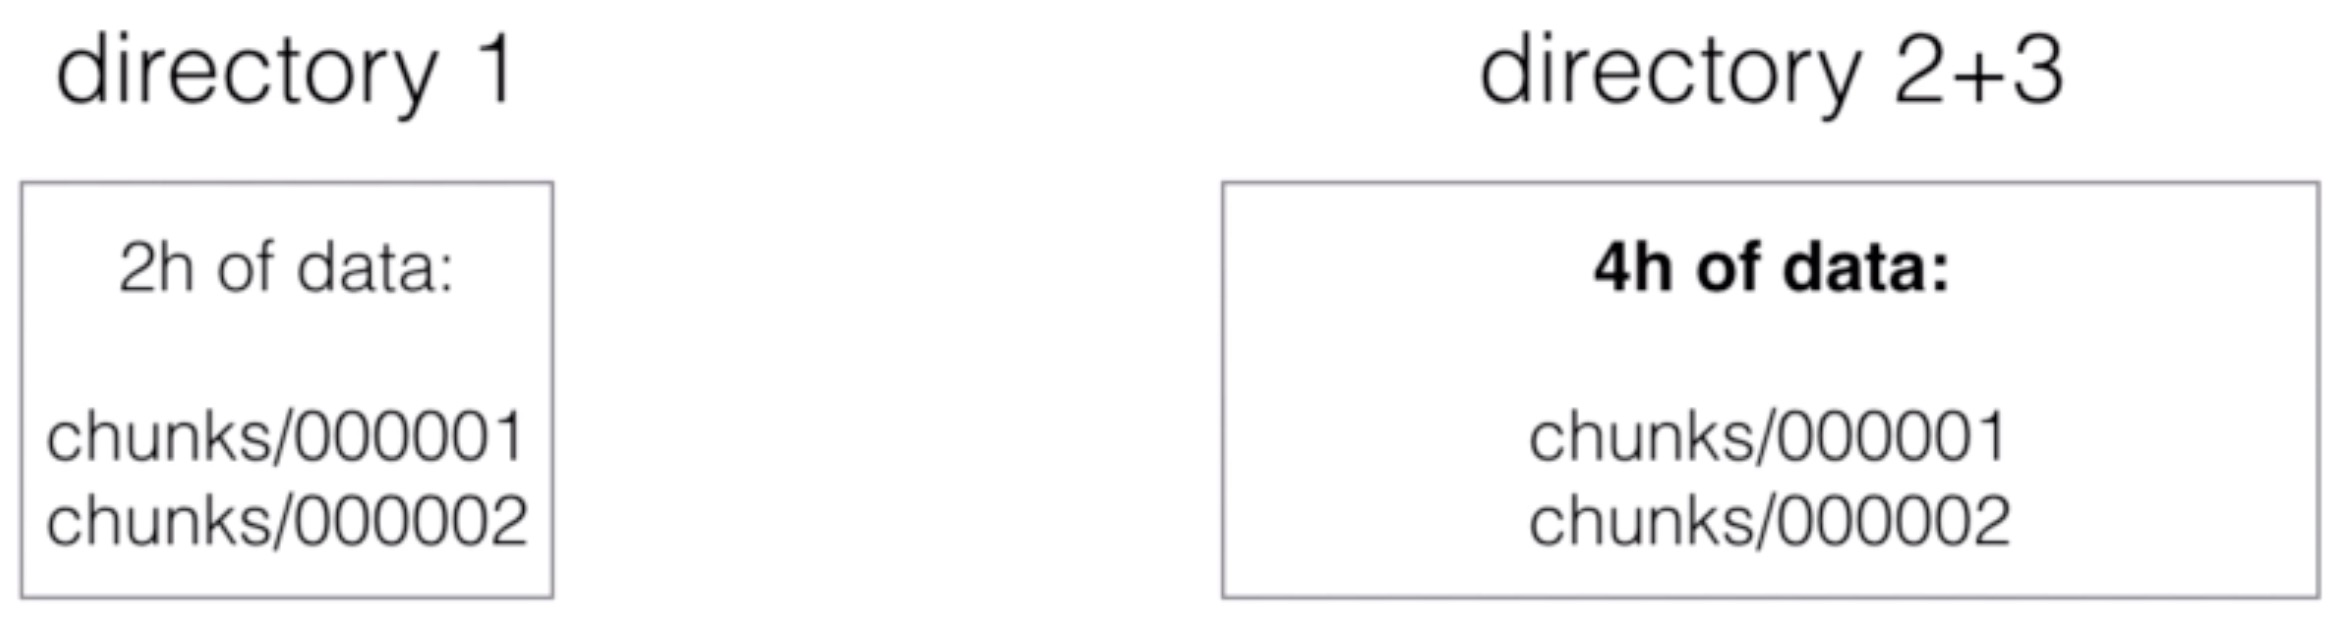
- The initial 2-hour blocks are merged in the background to form longer blocks
- This is called compaction
Block characteristics
- A block on the filesystem is a directory with chunks
- You can see each block as a fully independent database containing all time series for the window
- Every block of data, except the current block, is immutable (no changes can be made)
- These non-overlapping blocks are actually a horizontal partitioning of the ingested time series data
- This horizontal partitioning gives a lot of benefit:
- When querying, the blocks not in the time range can be skipped
- When completing a block, data only needs to be added, and not modified (avoids write-amplification)
- Recent data is kept in memory, so can be queried quicker
- Deleting old data is only a matter of deleting directories on the filesystem
Compaction
- When querying, blocks have to be merged together to be able to calculate the results
- Too many blocks could cause too much merging overhead, so blocks are compacted
- 2 blocks are merged and form a newly created (often larger) block
- Compaction can also modify data: dropping deleted data or restructuring the chunks to increase the query performance
The index
- Having horizontal partitioning already makes most queries quicker but not those that need to go through all the data to get the results
- The index is an inverted index to provide better query performance, also in cases where all data needs to be queried
- Each series is assigned a unique ID (e.g. ID 1, 2 and 3)
- The index will contain an inverted index for the labels, for example for label env=production, it’ll have 1 and 3 as IDs for those series that have that label assigned
- What about disk size?
- On average, Prometheus needs 1-2 bytes per sample
- You can use the following formula to calculate the disk space you need:
needed_disk_space = retention_time_seconds * ingested_samples_per_second * bytes_per_sample
- How to reduced disk size?
- You can increase the scrape interval, which gets you less data
- You can decrease the targets or series you scrape
- Or you can reduce the retention (how long you keep the data)
--storage.tsdb.retention: This determines when to remove old data. Defaults to 15d
References
- To read the full story of Prometheus time series database, read the blog post from Fabian Reinartz at https://fabxc.org/tsdb/
Security
- At the moment Prometheus doesn’t offer any support for authentication or encryption (TLS) on the server components
- They argue that they’re focusing on building a monitoring solution and want to avoid having to implement complex security features
- You can still enable authentication and TLS using a reverse proxy
- This is only valid for server components, Prometheus can scrape TLS and authentication enabled targets
- See tls_config in the Prometheus configuration to configure a CA certificate, user certificate and user key
- You’d still need to setup a reverse proxy for the targets
Enable TLS with reverse proxy
HOST="localhost"
PORT="9090"

# install nginx and openssl
yum -y install nginx openssl apache2-utils

# generate ssl certificate (host prometheus.example.com)
openssl req -x509 -newkey rsa:4096 -keyout key.pem -out cert.pem -days 365 -subj '/CN=prometheus.example.com' -nodes
mv key.pem /etc/ssl/private/nginx.pem
chmod 600 /etc/ssl/private/nginx.pem
mv cert.pem /etc/ssl/certs/nginx.pem

echo 'server {
  listen 443;
  ssl    on;
  ssl_certificate /etc/ssl/certs/nginx.pem;
  ssl_certificate_key /etc/ssl/private/nginx.pem;
  location / {
    proxy_pass http://'${HOST}':'${PORT}'/;
    auth_basic "Prometheus";
    auth_basic_user_file /etc/nginx/.htpasswd;
  }
}' > /etc/nginx/sites-enabled/prometheus

systemctl enable nginx
systemctl restart nginx

htpasswd -c /etc/nginx/.htpasswd <username>
Enable mutual TLS for targets
- With mutual TLS both the server and the target need a certificate
- Run the below on the Prometheus server
mutual-tls.sh
TARGET_IP="138.68.135.9"

echo '
# From http://apetec.com/support/GenerateSAN-CSR.htm

[req]
distinguished_name = req_distinguished_name
req_extensions = v3_req

[req_distinguished_name]
countryName = Country Name (2 letter code)
countryName_default = US
stateOrProvinceName = State or Province Name (full name)
stateOrProvinceName_default = MN
localityName = Locality Name (eg, city)
localityName_default = Minneapolis
organizationalUnitName      = Organizational Unit Name (eg, section)
organizationalUnitName_default      = Domain Control Validated
commonName = Internet Widgits Ltd
commonName_max      = 64

[ v3_req ]
# Extensions to add to a certificate request
basicConstraints = CA:FALSE
extendedKeyUsage = clientAuth,serverAuth
subjectAltName = @alt_names

[alt_names]' > openssl-${TARGET_IP}.cnf

echo -en "IP.1 = ${TARGET_IP}\n" >> openssl-${TARGET_IP}.cnf


# create CA
openssl genrsa -out ca.key 4096 -nodes
chmod 400 ca.key
openssl req -new -x509 -sha256 -days 3650 -key ca.key -out ca.crt -subj "/CN=prometheus-ca.example.com"
chmod 644 ca.crt

# Create target key
openssl genrsa -out target.key 2048
chmod 400 target.key
openssl req -new -key target.key -sha256 -out target.csr -config openssl-${TARGET_IP}.cnf -subj "/CN=prometheus-target.example.com"

openssl x509 -req -days 365 -sha256 -in target.csr -CA ca.crt -CAkey ca.key -set_serial 1 -out target.crt -extensions v3_req -extfile openssl-${TARGET_IP}.cnf
chmod 444 target.crt

# Create client key for prometheus server
openssl genrsa -out client.key 2048
openssl req -new -key client.key -out client.csr -subj "/CN=prometheus.example.com"
openssl x509 -req -days 365 -sha256 -in client.csr -CA ca.crt -CAkey ca.key -set_serial 2 -out client.crt

mv ca.crt /etc/ssl/certs/prometheus-ca.crt
mv ca.key /etc/ssl/private/prometheus-ca.key
mv client.key /etc/prometheus/prometheus.key
chown prometheus:prometheus /etc/prometheus/prometheus.key
mv client.crt /etc/ssl/certs/prometheus.crt

echo 'Add the following lines to /etc/prometheus/prometheus.yml:'
echo "  - job_name: 'node_exporter_ssl'
    scrape_interval: 5s
    scheme: https
    tls_config:
      ca_file: /etc/ssl/certs/prometheus-ca.crt
      cert_file: /etc/ssl/certs/prometheus.crt
      key_file: /etc/prometheus/prometheus.key
    static_configs:
      - targets: ['${TARGET_IP}:443']"
- Run the below on the node to scrape over TLS
mv target.crt /etc/ssl/certs/target.crt
mv target.key /etc/ssl/private/target.key
mv prometheus-ca.crt /etc/ssl/certs/prometheus-ca.crt

HOST="localhost"
PORT="9100"

# run script as root or with sudo

# install nginx and openssl
apt -y install nginx openssl

echo 'server {
  listen 443;
  ssl    on;
  ssl_certificate /etc/ssl/certs/target.crt;
  ssl_certificate_key /etc/ssl/private/target.key;
  ssl_client_certificate /etc/ssl/certs/prometheus-ca.crt;
  ssl_verify_client on;
  location / {
    proxy_pass http://'${HOST}':'${PORT}'/;
  }
}' > /etc/nginx/sites-enabled/node-exporter

systemctl enable nginx
systemctl restart nginx

EXTERNAL_IP=$(curl -s ifconfig.co)
echo "Reverse proxy with mutual tls enabled on https://${EXTERNAL_IP}"
Use cases
Monitor a web application
Python Flask and MysQL scenario
- We’ll integrate Prometheus monitoring with a web application based on Python
- The official
prometheus_clientPython library will be used - Flask will be the web framework
- It’ll create a HTTP server with configured routes (e.g. /query)
- We’ll use
mysqlclientfor Python to query a MySQL database- We will include one normal query and one ‘misbehaving’ query that will take between 0 and 10 seconds to execute
- The official
- We will use the Counter and Histogram metric types to capture the data:
- A Counter to capture the amount of times a HTTP endpoint is hit + to capture the amount of times a MySQL query is
executed
- The value of the Counter mus always increase. That’s why you should take the Counter type for these types of data
- A Histogram to capture the latency of the HTTP requests and the MySQL queries
- A Histogram samples observations (like latencies) and counts them in configurable buckets. It also provides a sum of all observed values.
- The default buckets are intended to cover a typical web/rpc request from milliseconds to seconds
- A Counter to capture the amount of times a HTTP endpoint is hit + to capture the amount of times a MySQL query is
executed
- This is how we’ll define the data types in Python for Prometheus:
from prometheus_client import Counter, Histogram

FLASK_REQUEST_LATENCY = Histogram('flask_request_latency_seconds', 'Flask Request Latency', ['method', 'endpoint'])
FLASK_REQUEST_COUNT = Counter('flask_request_count', 'Flask Request Count', ['method', 'endpoint', 'http_status'])
MYSQL_REQUEST_LATENCY = Histogram('mysql_query_latency_seconds', 'MySQL Query Latency', ['query'])
MYSQL_REQUEST_COUNT = Counter('mysql_query_count', 'MySQL Query Count', ['query'])
- This is how we’ll calculate the latency of a query:
start_time = time.time()

sql = "select * from table"

query_latency = time.time() - start_time

MYSQL_REQUEST_LATENCY.labels(sql[:50]).observe(query_latency)
MYSQL_REQUEST_COUNT.labels(sql[:50]).inc()
Application files and deployment
flask-prometheus/__init__.py
# modified version of https://github.com/sbarratt/flask-prometheus

import time

import _mysql
import os

from prometheus_client import Counter, Histogram
from prometheus_client import start_http_server
from flask import request

FLASK_REQUEST_LATENCY = Histogram('flask_request_latency_seconds', 'Flask Request Latency',
                ['method', 'endpoint'])
FLASK_REQUEST_COUNT = Counter('flask_request_count', 'Flask Request Count',
                ['method', 'endpoint', 'http_status'])

MYSQL_REQUEST_LATENCY = Histogram('mysql_query_latency_seconds', 'MYSQL Query Latency',
                ['query'])
MYSQL_REQUEST_COUNT = Counter('mysql_query_count', 'Flask Request Count',
                ['query'])


def before_request():
    request.start_time = time.time()


def after_request(response):
    request_latency = time.time() - request.start_time
    FLASK_REQUEST_LATENCY.labels(request.method, request.path).observe(request_latency)
    FLASK_REQUEST_COUNT.labels(request.method, request.path, response.status_code).inc()

    return response


def monitor(app, port=8000, addr=''):
    app.before_request(before_request)
    app.after_request(after_request)
    start_http_server(port, addr)


def mysql_fetchall(db, sql):
    # get start time
    start_time = time.time()
    # execute query
    cursor = db.cursor()
    cursor.execute(sql)
    data=cursor.fetchall()
    # log finish time
    query_latency = time.time() - start_time
    MYSQL_REQUEST_LATENCY.labels(sql[:50]).observe(query_latency)
    MYSQL_REQUEST_COUNT.labels(sql[:50]).inc()
    # return data
    return data
main.py
#!/usr/bin/python

import MySQLdb
import os

from flask import Flask
from flask_prometheus import monitor, mysql_fetchall

# flask
app = Flask(__name__)

# database
db=MySQLdb.connect(host=os.getenv("MYSQL_HOST", "localhost"),
                  user=os.getenv("MYSQL_USER", "root"),
                  passwd=os.getenv("MYSQL_PASSWORD", ""),
                  db=os.getenv("MYSQL_DB", "app"))


# routing
@app.route('/')
def index():
  return "Flask is up & running\n"


@app.route('/query')
def query():
  res = mysql_fetchall(db, "select 1 as id, RAND()*10 as rand union select 2 as id, RAND()*100 as rand")
  output = ""
  for row in res:
    line = ",".join(str(s) for s in row)
    output += line+"\n"
  return output


@app.route('/sleep')
def sleep():
  res = mysql_fetchall(db, "select SLEEP(RAND()*10) as sleeping")
  return "Done!"

# monitoring
monitor(app, port=8000)
# run app
app.run(host="0.0.0.0")
Dockerfile
FROM python:3-alpine
WORKDIR /usr/src/app
COPY requirements.txt ./
RUN apk --update add --no-cache mariadb-dev gcc musl-dev && \
pip install --no-cache-dir -r requirements.txt && \
apk del gcc musl-dev
RUN apk --update add bash && \
wget -q -O /wait-for-it.sh https://raw.githubusercontent.com/vishnubob/wait-for-it/master/wait-for-it.sh && \
chmod +x /wait-for-it.sh
COPY . .
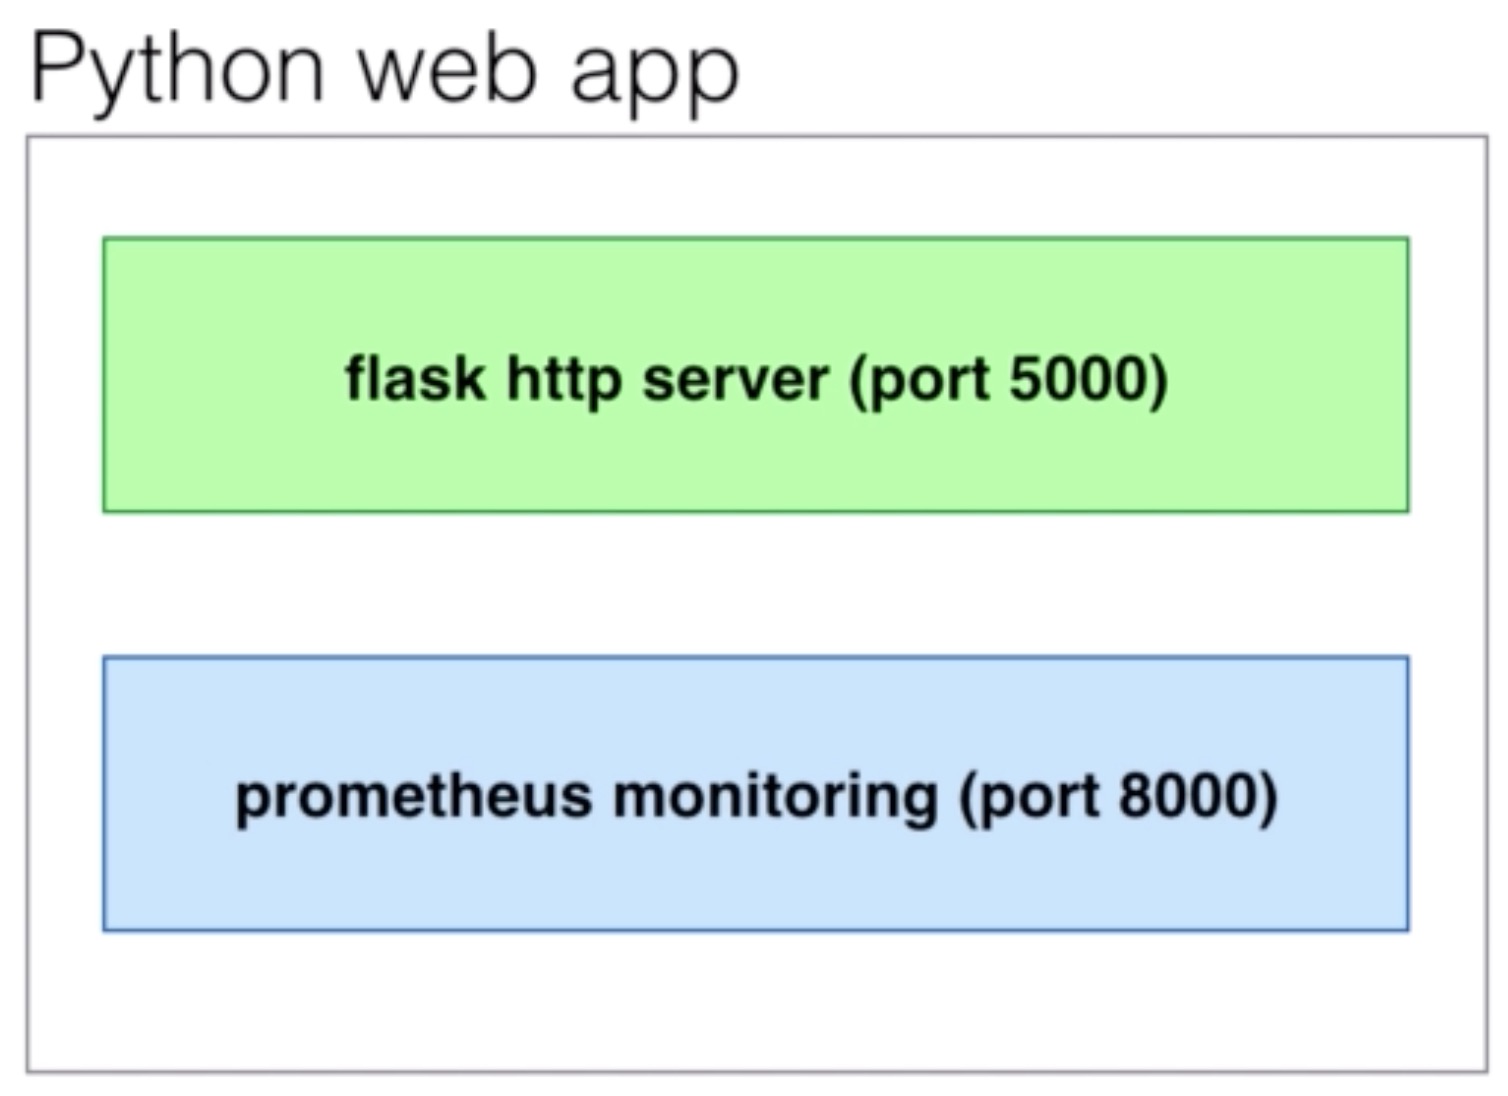
EXPOSE 5000
EXPOSE 8000
CMD [ "python", "./main.py" ]
requirements.txt
mysqlclient
flask
prometheus_client
docker-compose.yml
version: '3'
services:
  flask-prometheus-example:
    ports:
      - "5000:5000"
      - "8000:8000"
    environment:
      MYSQL_HOST: mysql
      MYSQL_USER: root
      MYSQL_PASSWORD: app
      MYSQL_DB: app
    image: "wardviaene/flask-prometheus-example"
    depends_on:
      - mysql
    command: ["/wait-for-it.sh", "mysql:3306", "--", "python", "./main.py"]
  mysql:
    image: "mysql:5.7"
    environment:
      MYSQL_ROOT_PASSWORD: app
      MYSQL_DATABASE: app
- To easily deploy run docker-compose
docker-compose up -d
- Add the application to your Prometheus configuration scrape_configs
- job_name: 'flask_app'
  scrape_interval: 5s
  static_configs:
    - targets: ['localhost:8000']
- reload Prometheus to apply the config change
kill -HUP <pid of prometheus>
Cloudwatch exporter
- Installation
- Configuration (exporter and AWS)
- Charges + measuring them
- Querying metrics
Installation
CLOUDWATCH_EXPORTER_VERSION="0.5.0"
wget -O /usr/local/bin/cloudwatch_exporter.jar http://search.maven.org/remotecontent?filepath=io/prometheus/cloudwatch/cloudwatch_exporter/${CLOUDWATCH_EXPORTER_VERSION}/cloudwatch_exporter-${CLOUDWATCH_EXPORTER_VERSION}-jar-with-dependencies.jar

#install java
yum install -y openjdk-9-jre-headless

#create configuration directory
mkdir -p /etc/cloudwatchexporter
touch /etc/cloudwatchexporter/cloudwatchexporter.yml
mkdir -p ~/.aws/
touch ~/.aws/credentials

#aws credentail template
echo '[default]
aws_access_key_id=YOUR_ACCESS_KEY_ID
aws_secret_access_key=YOUR_SECRET_ACCESS_KEY' >> ~/.aws/credentials

echo '[Unit]
Description=CLoudwatch Exporter
Wants=network-online.target
After=network-online.target

[Service]
User=root
Group=root
Type=simple
ExecStart=/usr/bin/java -jar /usr/local/bin/cloudwatch_exporter.jar 9106 /etc/cloudwatchexporter/cloudwatchexporter.yml

[Install]
WantedBy=multi-user.target' > /etc/systemd/system/cloudwatch_exporter.service

# enable node_exporter in systemctl
systemctl daemon-reload
systemctl enable cloudwatch_exporter
- Add your AWS keys to ~/.aws/credentials (IAM permissions needed: cloudwatch:ListMetrics and cloudwatch:GetMetricStatistics needed)
- Add the following lines to /etc/prometheus/prometheus.yml:
- job_name: 'cloudwatch_exporter'
  scrape_interval: 5s
  static_configs:
    - targets: ['localhost:9106']
- Add the following lines to /etc/cloudwatchexporter/cloudwatchexporter.yml:
---
region: eu-west-1
metrics:
- aws_namespace: AWS/ELB
  aws_metric_name: HealthyHostCount
  aws_dimensions: [AvailabilityZone, LoadBalancerName]
  aws_statistics: [Average]

- run: systemctl start cloudwatch_exporter
Grafana Provisioning
- Rather than using the UI, you can also use yaml and json files to provision Grafana with datasources and dashboards
- This is a much more powerful way of using Grafana, as you can test new dashboards on a dev/test server and then
import the newly created dashboards to production
- You can do the import manually through the UI or by using the yaml and json files
- When using files, you can keep files within a version control system to keep changes, revisions and backups
- The configuration of Grafana is all kept in /etc/grafana
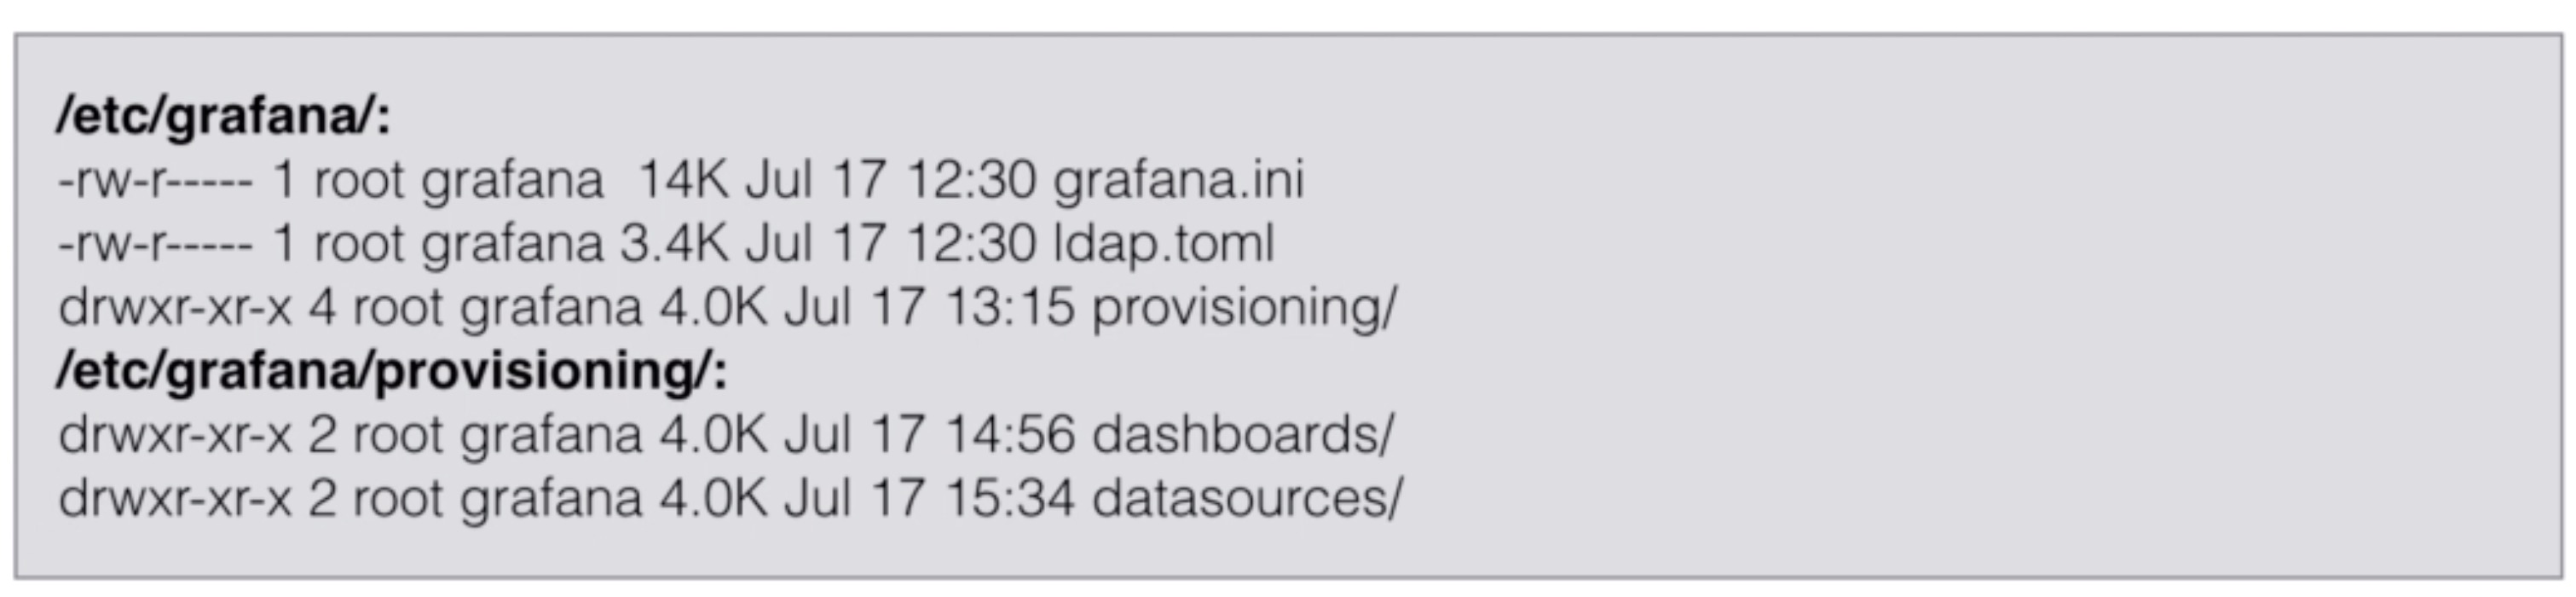
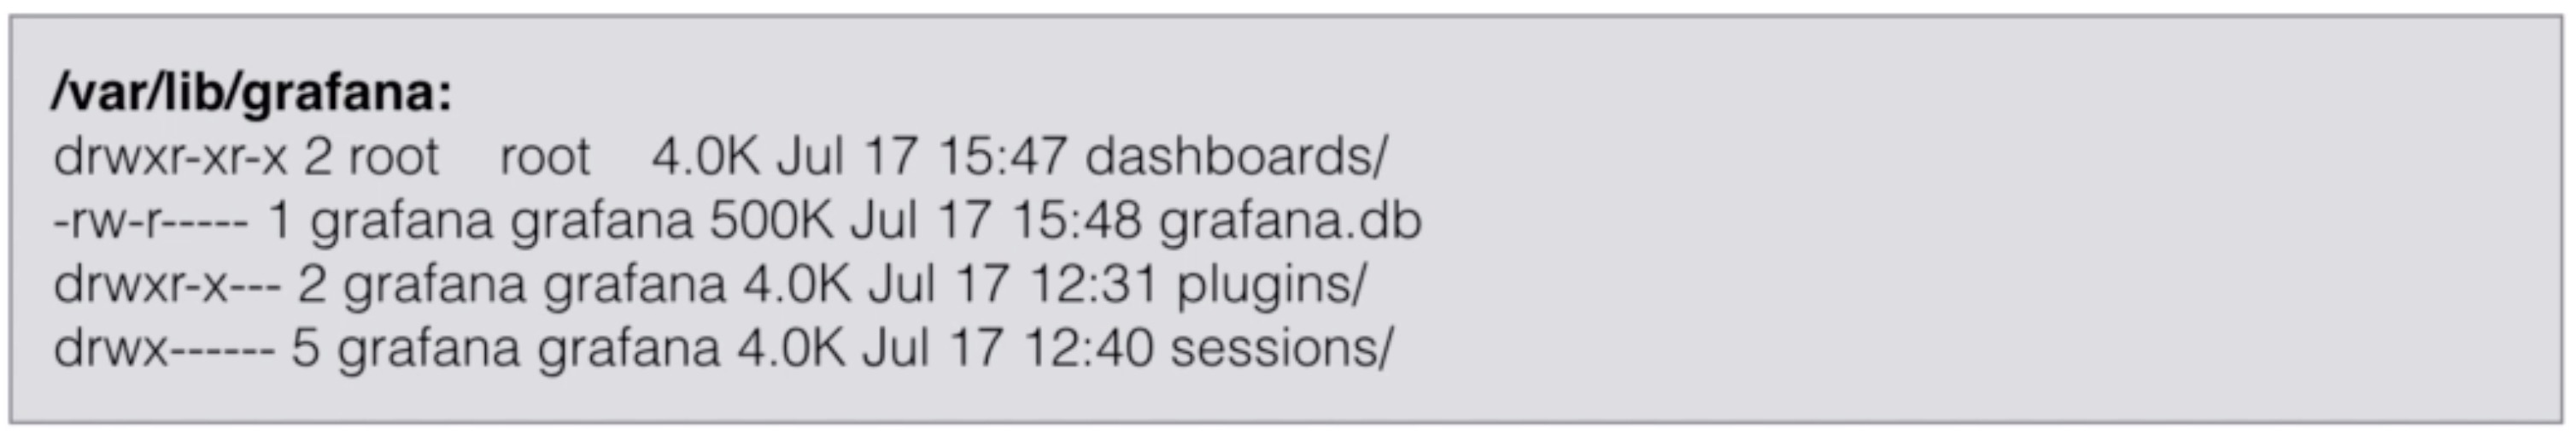
- The data itself is kept in /var/lib/grafana
- You can change the database and paths in /etc/grafana/grafana.ini

Installation
echo '[grafana]
name=grafana
baseurl=https://packagecloud.io/grafana/stable/el/7/$basearch
repo_gpgcheck=1
enabled=1
gpgcheck=1
gpgkey=https://packagecloud.io/gpg.key https://grafanarel.s3.amazonaws.com/RPM-GPG-KEY-grafana
sslverify=1
sslcacert=/etc/pki/tls/certs/ca-bundle.crt' > /etc/yum.repos.d/grafana.repo

yum install grafana -y

systemctl daemon-reload
systemctl start grafana-server
systemctl enable grafana-server.service
Condigure datasource
- Copy the below into /etc/grafana/provisioning/datasources
datasource-prometheus.yml
apiVersion: 1
datasources:
 - name: Prometheus
   type: prometheus
   orgId: 1
   url: http://localhost:9090
   access: proxy
   version: 1
   editable: false
   isDefault: true
Configure dashboard
- Copy the below into /etc/grafana/provisioning/dashboards
dashboards.yml
apiVersion: 1
providers:
 - name: 'default'
   orgId: 1
   folder: ''
   type: file
   options:
     path: /var/lib/grafana/dashboards
- You can now save your json files for the dashboards in version control and deploy them on any Grafana server by putting them in the above indicated path. Below is an example of a dashboard
node-dashboard.json
{
  "annotations": {
    "list": [
      {
        "builtIn": 1,
        "datasource": "-- Grafana --",
        "enable": true,
        "hide": true,
        "iconColor": "rgba(0, 211, 255, 1)",
        "name": "Annotations & Alerts",
        "type": "dashboard"
      }
    ]
  },
  "editable": true,
  "gnetId": null,
  "graphTooltip": 0,
  "id": 5,
  "links": [],
  "panels": [
    {
      "aliasColors": {},
      "bars": false,
      "dashLength": 10,
      "dashes": false,
      "datasource": null,
      "fill": 1,
      "gridPos": {
        "h": 9,
        "w": 12,
        "x": 0,
        "y": 0
      },
      "id": 4,
      "legend": {
        "avg": false,
        "current": false,
        "max": false,
        "min": false,
        "show": true,
        "total": false,
        "values": false
      },
      "lines": true,
      "linewidth": 1,
      "links": [],
      "nullPointMode": "null",
      "percentage": false,
      "pointradius": 5,
      "points": false,
      "renderer": "flot",
      "seriesOverrides": [],
      "spaceLength": 10,
      "stack": false,
      "steppedLine": false,
      "targets": [
        {
          "expr": "sum( node_memory_MemAvailable_bytes ) by (instance) / 1024 / 1024 / 1024\n",
          "format": "time_series",
          "hide": false,
          "intervalFactor": 1,
          "refId": "A"
        }
      ],
      "thresholds": [],
      "timeFrom": null,
      "timeShift": null,
      "title": "Free Memory",
      "tooltip": {
        "shared": true,
        "sort": 0,
        "value_type": "individual"
      },
      "type": "graph",
      "xaxis": {
        "buckets": null,
        "mode": "time",
        "name": null,
        "show": true,
        "values": []
      },
      "yaxes": [
        {
          "decimals": null,
          "format": "short",
          "label": "Mem / GB",
          "logBase": 1,
          "max": null,
          "min": null,
          "show": true
        },
        {
          "format": "short",
          "label": null,
          "logBase": 1,
          "max": null,
          "min": null,
          "show": true
        }
      ],
      "yaxis": {
        "align": false,
        "alignLevel": null
      }
    },
    {
      "aliasColors": {},
      "bars": false,
      "dashLength": 10,
      "dashes": false,
      "datasource": null,
      "fill": 1,
      "gridPos": {
        "h": 9,
        "w": 12,
        "x": 12,
        "y": 0
      },
      "id": 2,
      "legend": {
        "avg": false,
        "current": false,
        "max": false,
        "min": false,
        "show": true,
        "total": false,
        "values": false
      },
      "lines": true,
      "linewidth": 1,
      "links": [],
      "nullPointMode": "null",
      "percentage": false,
      "pointradius": 5,
      "points": false,
      "renderer": "flot",
      "seriesOverrides": [],
      "spaceLength": 10,
      "stack": false,
      "steppedLine": false,
      "targets": [
        {
          "expr": "100 - (avg by (instance) (irate(node_cpu_seconds_total{job=\"node_exporter\",mode=\"idle\"}[5m])) * 100)\n",
          "format": "time_series",
          "hide": false,
          "intervalFactor": 1,
          "refId": "A"
        }
      ],
      "thresholds": [],
      "timeFrom": null,
      "timeShift": null,
      "title": "CPU Usage",
      "tooltip": {
        "shared": true,
        "sort": 0,
        "value_type": "individual"
      },
      "type": "graph",
      "xaxis": {
        "buckets": null,
        "mode": "time",
        "name": null,
        "show": true,
        "values": []
      },
      "yaxes": [
        {
          "decimals": null,
          "format": "short",
          "label": "CPU %",
          "logBase": 1,
          "max": "100",
          "min": "0",
          "show": true
        },
        {
          "format": "short",
          "label": null,
          "logBase": 1,
          "max": null,
          "min": null,
          "show": true
        }
      ],
      "yaxis": {
        "align": false,
        "alignLevel": null
      }
    }
  ],
  "schemaVersion": 16,
  "style": "dark",
  "tags": [],
  "templating": {
    "list": []
  },
  "time": {
    "from": "now-6h",
    "to": "now"
  },
  "timepicker": {
    "refresh_intervals": [
      "5s",
      "10s",
      "30s",
      "1m",
      "5m",
      "15m",
      "30m",
      "1h",
      "2h",
      "1d"
    ],
    "time_options": [
      "5m",
      "15m",
      "1h",
      "6h",
      "12h",
      "24h",
      "2d",
      "7d",
      "30d"
    ]
  },
  "timezone": "",
  "title": "Node Statistics",
  "uid": "KchAVsdmk",
  "version": 3
}
- Restart Grafana to make sure it loads the files you put in the path
systemctl restart grafana-server
Scraping Kubernetes with Prometheus
- In order to get Kubernetes metrics using Prometheus we install Prometheus on our cluster
## Install Helm
wget https://storage.googleapis.com/kubernetes-helm/helm-v2.11.0-linux-amd64.tar.gz
tar -xzvf helm-v2.11.0-linux-amd64.tar.gz
sudo mv linux-amd64/helm /usr/local/bin/helm

## Create service account and role for Tiller
kubectl create -f https://raw.githubusercontent.com/wardviaene/kubernetes-course/master/helm/helm-rbac.yaml

## Initialize Helm
helm init --service-account tiller

## Start Prometheus (without storage)
helm install --name prometheus --set server.persistentVolume.enabled=false,alertmanager.persistentVolume.enabled=false stable/prometheus

## Exposing prometheus port
export POD_NAME=$(kubectl get pods --namespace default -l "app=prometheus,component=server" -o jsonpath="{.items[0].metadata.name}")
kubectl --namespace default port-forward $POD_NAME 9090 &

## Use socat to forward the port to all IPs so you can access from outside
socat TCP4-LISTEN:9091,fork TCP4:localhost:9090 &
Consul integration
Consul is a distributed highly available solution providing:
- A service mesh
- Service discovery
- Health checks for your services
- A key-value store
- Secure service communications
- Multi-datacenter support
Consul is often deployed in conjuction with Docker
There are 2 integrations that are interesting to use:
- Prometheus can scrape Consul’s metrics and provide you with all sorts of information about your running services
- Consul provides service discovery, so it knows where services are running and what the current state of them is
- Consul can be integrated within Prometheus to automatically add the services as targets
- Consul will discover your services and these can then be automatically added to Prometheus as a target
Add the following lines to /etc/prometheus/prometheus.yml:
- job_name: 'consul'
  consul_sd_configs:
    - server:   '127.0.0.1:8500'

  relabel_configs:
  - source_labels: ['__meta_consul_service']
    regex:         '(.*)'
    target_label:  'job'
    replacement:   '\$1'
  - source_labels: ['__meta_consul_node']
    regex:         '(.*)'
    target_label:  'instance'
    replacement:   '\$1'
  - source_labels: ['__meta_consul_tags']
    regex:         ',(dev|production|canary),'
    target_label:  'group'
    replacement:   '\$1'
- Manually register a service with Consul
IP=$(curl -s ifconfig.co)
curl -X PUT -d '{
  "ID": "python-flask",
  "Name": "python-flask",
  "Address": "'${IP}'",
  "Port": 8000,
  "Check": {
    "Name": "HTTP check",
    "Interval": "30s",
    "HTTP": "http://'${IP}':5000/"
  }
}' http://localhost:8500/v1/agent/service/register
- You can also configure the consul-exporter in Prometheus to get some node / service health checks
Installing consul-exporter
CONSUL_EXPORTER_VERSION="0.4.0"
wget https://github.com/prometheus/consul_exporter/releases/download/v${CONSUL_EXPORTER_VERSION}/consul_exporter-${CONSUL_EXPORTER_VERSION}.linux-amd64.tar.gz
tar -xzvf consul_exporter-${CONSUL_EXPORTER_VERSION}.linux-amd64.tar.gz
cd consul_exporter-${CONSUL_EXPORTER_VERSION}.linux-amd64
cp consul_exporter /usr/local/bin

# create user
useradd --no-create-home --shell /bin/false consul_exporter

chown consul_exporter:consul_exporter /usr/local/bin/consul_exporter

echo '[Unit]
Description=Consul Exporter
Wants=network-online.target
After=network-online.target

[Service]
User=consul_exporter
Group=consul_exporter
Type=simple
ExecStart=/usr/local/bin/consul_exporter

[Install]
WantedBy=multi-user.target' > /etc/systemd/system/consul_exporter.service

# enable consul_exporter in systemctl
systemctl daemon-reload
systemctl start consul_exporter
systemctl enable consul_exporter
- Add the following to your Prometheus configuration to scrape the Consul Exporter
- job_name: 'consul_exporter'
  scrape_interval: 5s
  static_configs:
    - targets: ['localhost:9107']
EC2 Auto discovery
- Service discovery is the automatic detection of devices and services offered by these devices on a computer network
- In this use-case we will:
- create prerequisites in AWS (IAM role, Security Groups, EC2 Instances)
- alter Prometheus configuration (/etc/prometheus/prometheus.yml)
- query the data in Grafana
- Create a user with programmatic access on AWS and attach the predefined policy AmazonEC2ReadOnlyAccess
- Alter Prometheus config: /etc/prometheus/prometheus.yml
- job_name: 'ec2_nodes'
  ec2_sd_configs:
    - region: eu-west-1
      access_key: PUT_THE_ACCESS_KEY_HERE
      secret_key: PUT_THE_SECRET_KEY_HERE
      port: 9100
  relabel_configs:
    - source_labels: [__meta_ec2_tag_Name]
      regex: Prometheus.*
      action: keep
    - source_labels: [__meta_ec2_public_ip]
      regex:  '(.*)'
      target_label: __address__
      replacement: '${1}:9100'
- The EC2 instances need the following in the advanced config in order to automatically install the node-exporter
#!/usr/bin/env bash
wget -O - https://raw.githubusercontent.com/in4it/prometheus-course/master/scripts/2-node-exporter.sh | bash
- Create a graph for the CPU average on Grafana with the following query
100 - (avg by (instance) (irate(node_cpu_seconds_total{job="ec2_nodes",mode="idle"}[5m])) * 100)