Kubernetes Advanced Usage
Course Overview
| Advanced Kubernetes Usage | Technologies |
| Logging | ElasticSearch (as StatefulSet), fluentd, Kibana, LogTrail |
| Authentication | OpenID Connect (OIDC), Auth0 |
| Authorization | Kubernetes RBAC |
| Packaging | Helm |
| The Job | Resource |
| Job Scheduling | CronJob |
| Deploying on Kubernetes | Spinnaker |
| Microservices on Kubernetes | Linkerd |
| Federation | kubefed |
| Monitoring | Prometheus |
Logging with fluentd
- Logging is important to show errors, information and debugging data about the application
- When you only run one app, it is pretty obvious how to look for the logs
- You’d just open the “app.log”-file to see what’s going on
- Or if deployed as a pod, with kubectl logs
- With Kubernetes 1 application will be running as one or many pods
- Finding an error will be much more difficult: what pod do you have to look at?
- Up until now you might have been using “kubectl logs” to get the log details of a pod
- To get the correct information, you might have to look up:
- The pod name
- The container names
- And run kubectl logs for every container in every pod that is running for an application
- Note: you can use both kubectl log and kubectl logs
- The solution for this problem is to do Log Aggregation
- It’s not Kubernetes specific
- It’s already applied for years, even with syslog (a standard for message logging since 1980s)
- Log Aggregation is nowadays often implemented with more modern tools
- the ELK Stack (ElasticSearch + Logstash + Kibana)
- Several hosted services like loggly.com, papertrailapp.com
- I’ll show you how to setup centralized logging using:
- Fluentd (For log forwarding)
- ElasticSearch (For log indexing)
- Kibana (For visualisation)
- LogTrail (an easy to use UI to show logs)
- This solution can be easily customized, you can create custom dashboards to show what is important for you
Setup (AWS)
storage.yaml
kind: StorageClass
apiVersion: storage.k8s.io/v1beta1
metadata:
  name: standard
provisioner: kubernetes.io/aws-ebs
parameters:
  type: gp2
  zone: eu-west-1a
es-statefulset.yaml
# RBAC authn and authz
apiVersion: v1
kind: ServiceAccount
metadata:
  name: elasticsearch-logging
  namespace: kube-system
  labels:
    k8s-app: elasticsearch-logging
    kubernetes.io/cluster-service: "true"
    addonmanager.kubernetes.io/mode: Reconcile
---
kind: ClusterRole
apiVersion: rbac.authorization.k8s.io/v1beta1
metadata:
  name: elasticsearch-logging
  labels:
    k8s-app: elasticsearch-logging
    kubernetes.io/cluster-service: "true"
    addonmanager.kubernetes.io/mode: Reconcile
rules:
- apiGroups:
  - ""
  resources:
  - "services"
  - "namespaces"
  - "endpoints"
  verbs:
  - "get"
---
kind: ClusterRoleBinding
apiVersion: rbac.authorization.k8s.io/v1beta1
metadata:
  namespace: kube-system
  name: elasticsearch-logging
  labels:
    k8s-app: elasticsearch-logging
    kubernetes.io/cluster-service: "true"
    addonmanager.kubernetes.io/mode: Reconcile
subjects:
- kind: ServiceAccount
  name: elasticsearch-logging
  namespace: kube-system
  apiGroup: ""
roleRef:
  kind: ClusterRole
  name: elasticsearch-logging
  apiGroup: ""
---
# Elasticsearch deployment itself
apiVersion: apps/v1beta1
kind: StatefulSet
metadata:
  name: elasticsearch-logging
  namespace: kube-system
  labels:
    k8s-app: elasticsearch-logging
    version: v5.5.1
    kubernetes.io/cluster-service: "true"
    addonmanager.kubernetes.io/mode: Reconcile
spec:
  serviceName: elasticsearch-logging
  replicas: 2
  selector:
    matchLabels:
      k8s-app: elasticsearch-logging
      version: v5.5.1
  template:
    metadata:
      labels:
        k8s-app: elasticsearch-logging
        version: v5.5.1
        kubernetes.io/cluster-service: "true"
    spec:
      serviceAccountName: elasticsearch-logging
      containers:
      - image: gcr.io/google-containers/elasticsearch:v5.5.1-1
        name: elasticsearch-logging
        resources:
          # need more cpu upon initialization, therefore burstable class
          limits:
            cpu: 1000m
            memory: 2.5Gi
          requests:
            memory: 2.5Gi
            cpu: 100m
        ports:
        - containerPort: 9200
          name: db
          protocol: TCP
        - containerPort: 9300
          name: transport
          protocol: TCP
        volumeMounts:
        - name: es-storage
          mountPath: /data
        env:
        - name: "NAMESPACE"
          valueFrom:
            fieldRef:
              fieldPath: metadata.namespace
        - name: "ES_JAVA_OPTS"
          value: "-XX:-AssumeMP"
      # Elasticsearch requires vm.max_map_count to be at least 262144.
      # If your OS already sets up this number to a higher value, feel free
      # to remove this init container.
      initContainers:
      - image: alpine:3.6
        command: ["/sbin/sysctl", "-w", "vm.max_map_count=262144"]
        name: elasticsearch-logging-init
        securityContext:
          privileged: true
  volumeClaimTemplates:
  - metadata:
      name: es-storage
    spec:
      accessModes: [ "ReadWriteOnce" ]
      storageClassName: standard
      resources:
        requests:
          storage: 8Gi
es-service.yaml
apiVersion: v1
kind: Service
metadata:
  name: elasticsearch-logging
  namespace: kube-system
  labels:
    k8s-app: elasticsearch-logging
    kubernetes.io/cluster-service: "true"
    addonmanager.kubernetes.io/mode: Reconcile
    kubernetes.io/name: "Elasticsearch"
spec:
  ports:
  - port: 9200
    protocol: TCP
    targetPort: db
  selector:
    k8s-app: elasticsearch-logging
fluentd-es-configmap.yaml
kind: ConfigMap
apiVersion: v1
data:
  containers.input.conf: |-
    # This configuration file for Fluentd / td-agent is used
    # to watch changes to Docker log files. The kubelet creates symlinks that
    # capture the pod name, namespace, container name & Docker container ID
    # to the docker logs for pods in the /var/log/containers directory on the host.
    # If running this fluentd configuration in a Docker container, the /var/log
    # directory should be mounted in the container.
    #
    # These logs are then submitted to Elasticsearch which assumes the
    # installation of the fluent-plugin-elasticsearch & the
    # fluent-plugin-kubernetes_metadata_filter plugins.
    # See https://github.com/uken/fluent-plugin-elasticsearch &
    # https://github.com/fabric8io/fluent-plugin-kubernetes_metadata_filter for
    # more information about the plugins.
    #
    # Example
    # =======
    # A line in the Docker log file might look like this JSON:
    #
    # {"log":"2014/09/25 21:15:03 Got request with path wombat\n",
    #  "stream":"stderr",
    #   "time":"2014-09-25T21:15:03.499185026Z"}
    #
    # The time_format specification below makes sure we properly
    # parse the time format produced by Docker. This will be
    # submitted to Elasticsearch and should appear like:
    # $ curl 'http://elasticsearch-logging:9200/_search?pretty'
    # ...
    # {
    #      "_index" : "logstash-2014.09.25",
    #      "_type" : "fluentd",
    #      "_id" : "VBrbor2QTuGpsQyTCdfzqA",
    #      "_score" : 1.0,
    #      "_source":{"log":"2014/09/25 22:45:50 Got request with path wombat\n",
    #                 "stream":"stderr","tag":"docker.container.all",
    #                 "@timestamp":"2014-09-25T22:45:50+00:00"}
    #    },
    # ...
    #
    # The Kubernetes fluentd plugin is used to write the Kubernetes metadata to the log
    # record & add labels to the log record if properly configured. This enables users
    # to filter & search logs on any metadata.
    # For example a Docker container's logs might be in the directory:
    #
    #  /var/lib/docker/containers/997599971ee6366d4a5920d25b79286ad45ff37a74494f262e3bc98d909d0a7b
    #
    # and in the file:
    #
    #  997599971ee6366d4a5920d25b79286ad45ff37a74494f262e3bc98d909d0a7b-json.log
    #
    # where 997599971ee6... is the Docker ID of the running container.
    # The Kubernetes kubelet makes a symbolic link to this file on the host machine
    # in the /var/log/containers directory which includes the pod name and the Kubernetes
    # container name:
    #
    #    synthetic-logger-0.25lps-pod_default_synth-lgr-997599971ee6366d4a5920d25b79286ad45ff37a74494f262e3bc98d909d0a7b.log
    #    ->
    #    /var/lib/docker/containers/997599971ee6366d4a5920d25b79286ad45ff37a74494f262e3bc98d909d0a7b/997599971ee6366d4a5920d25b79286ad45ff37a74494f262e3bc98d909d0a7b-json.log
    #
    # The /var/log directory on the host is mapped to the /var/log directory in the container
    # running this instance of Fluentd and we end up collecting the file:
    #
    #   /var/log/containers/synthetic-logger-0.25lps-pod_default_synth-lgr-997599971ee6366d4a5920d25b79286ad45ff37a74494f262e3bc98d909d0a7b.log
    #
    # This results in the tag:
    #
    #  var.log.containers.synthetic-logger-0.25lps-pod_default_synth-lgr-997599971ee6366d4a5920d25b79286ad45ff37a74494f262e3bc98d909d0a7b.log
    #
    # The Kubernetes fluentd plugin is used to extract the namespace, pod name & container name
    # which are added to the log message as a kubernetes field object & the Docker container ID
    # is also added under the docker field object.
    # The final tag is:
    #
    #   kubernetes.var.log.containers.synthetic-logger-0.25lps-pod_default_synth-lgr-997599971ee6366d4a5920d25b79286ad45ff37a74494f262e3bc98d909d0a7b.log
    #
    # And the final log record look like:
    #
    # {
    #   "log":"2014/09/25 21:15:03 Got request with path wombat\n",
    #   "stream":"stderr",
    #   "time":"2014-09-25T21:15:03.499185026Z",
    #   "kubernetes": {
    #     "namespace": "default",
    #     "pod_name": "synthetic-logger-0.25lps-pod",
    #     "container_name": "synth-lgr"
    #   },
    #   "docker": {
    #     "container_id": "997599971ee6366d4a5920d25b79286ad45ff37a74494f262e3bc98d909d0a7b"
    #   }
    # }
    #
    # This makes it easier for users to search for logs by pod name or by
    # the name of the Kubernetes container regardless of how many times the
    # Kubernetes pod has been restarted (resulting in a several Docker container IDs).

    # Example:
    # {"log":"[info:2016-02-16T16:04:05.930-08:00] Some log text here\n","stream":"stdout","time":"2016-02-17T00:04:05.931087621Z"}
    <source>
      type tail
      path /var/log/containers/*.log
      pos_file /var/log/es-containers.log.pos
      time_format %Y-%m-%dT%H:%M:%S.%NZ
      tag kubernetes.*
      format json
      read_from_head true
    </source>
  system.input.conf: |-
    # Example:
    # 2015-12-21 23:17:22,066 [salt.state       ][INFO    ] Completed state [net.ipv4.ip_forward] at time 23:17:22.066081
    <source>
      type tail
      format /^(?<time>[^ ]* [^ ,]*)[^\[]*\[[^\]]*\]\[(?<severity>[^ \]]*) *\] (?<message>.*)$/
      time_format %Y-%m-%d %H:%M:%S
      path /var/log/salt/minion
      pos_file /var/log/es-salt.pos
      tag salt
    </source>

    # Example:
    # Dec 21 23:17:22 gke-foo-1-1-4b5cbd14-node-4eoj startupscript: Finished running startup script /var/run/google.startup.script
    <source>
      type tail
      format syslog
      path /var/log/startupscript.log
      pos_file /var/log/es-startupscript.log.pos
      tag startupscript
    </source>

    # Examples:
    # time="2016-02-04T06:51:03.053580605Z" level=info msg="GET /containers/json"
    # time="2016-02-04T07:53:57.505612354Z" level=error msg="HTTP Error" err="No such image: -f" statusCode=404
    <source>
      type tail
      format /^time="(?<time>[^)]*)" level=(?<severity>[^ ]*) msg="(?<message>[^"]*)"( err="(?<error>[^"]*)")?( statusCode=($<status_code>\d+))?/
      path /var/log/docker.log
      pos_file /var/log/es-docker.log.pos
      tag docker
    </source>

    # Example:
    # 2016/02/04 06:52:38 filePurge: successfully removed file /var/etcd/data/member/wal/00000000000006d0-00000000010a23d1.wal
    <source>
      type tail
      # Not parsing this, because it doesn't have anything particularly useful to
      # parse out of it (like severities).
      format none
      path /var/log/etcd.log
      pos_file /var/log/es-etcd.log.pos
      tag etcd
    </source>

    # Multi-line parsing is required for all the kube logs because very large log
    # statements, such as those that include entire object bodies, get split into
    # multiple lines by glog.

    # Example:
    # I0204 07:32:30.020537    3368 server.go:1048] POST /stats/container/: (13.972191ms) 200 [[Go-http-client/1.1] 10.244.1.3:40537]
    <source>
      type tail
      format multiline
      multiline_flush_interval 5s
      format_firstline /^\w\d{4}/
      format1 /^(?<severity>\w)(?<time>\d{4} [^\s]*)\s+(?<pid>\d+)\s+(?<source>[^ \]]+)\] (?<message>.*)/
      time_format %m%d %H:%M:%S.%N
      path /var/log/kubelet.log
      pos_file /var/log/es-kubelet.log.pos
      tag kubelet
    </source>

    # Example:
    # I1118 21:26:53.975789       6 proxier.go:1096] Port "nodePort for kube-system/default-http-backend:http" (:31429/tcp) was open before and is still needed
    <source>
      type tail
      format multiline
      multiline_flush_interval 5s
      format_firstline /^\w\d{4}/
      format1 /^(?<severity>\w)(?<time>\d{4} [^\s]*)\s+(?<pid>\d+)\s+(?<source>[^ \]]+)\] (?<message>.*)/
      time_format %m%d %H:%M:%S.%N
      path /var/log/kube-proxy.log
      pos_file /var/log/es-kube-proxy.log.pos
      tag kube-proxy
    </source>

    # Example:
    # I0204 07:00:19.604280       5 handlers.go:131] GET /api/v1/nodes: (1.624207ms) 200 [[kube-controller-manager/v1.1.3 (linux/amd64) kubernetes/6a81b50] 127.0.0.1:38266]
    <source>
      type tail
      format multiline
      multiline_flush_interval 5s
      format_firstline /^\w\d{4}/
      format1 /^(?<severity>\w)(?<time>\d{4} [^\s]*)\s+(?<pid>\d+)\s+(?<source>[^ \]]+)\] (?<message>.*)/
      time_format %m%d %H:%M:%S.%N
      path /var/log/kube-apiserver.log
      pos_file /var/log/es-kube-apiserver.log.pos
      tag kube-apiserver
    </source>

    # Example:
    # I0204 06:55:31.872680       5 servicecontroller.go:277] LB already exists and doesn't need update for service kube-system/kube-ui
    <source>
      type tail
      format multiline
      multiline_flush_interval 5s
      format_firstline /^\w\d{4}/
      format1 /^(?<severity>\w)(?<time>\d{4} [^\s]*)\s+(?<pid>\d+)\s+(?<source>[^ \]]+)\] (?<message>.*)/
      time_format %m%d %H:%M:%S.%N
      path /var/log/kube-controller-manager.log
      pos_file /var/log/es-kube-controller-manager.log.pos
      tag kube-controller-manager
    </source>

    # Example:
    # W0204 06:49:18.239674       7 reflector.go:245] pkg/scheduler/factory/factory.go:193: watch of *api.Service ended with: 401: The event in requested index is outdated and cleared (the requested history has been cleared [2578313/2577886]) [2579312]
    <source>
      type tail
      format multiline
      multiline_flush_interval 5s
      format_firstline /^\w\d{4}/
      format1 /^(?<severity>\w)(?<time>\d{4} [^\s]*)\s+(?<pid>\d+)\s+(?<source>[^ \]]+)\] (?<message>.*)/
      time_format %m%d %H:%M:%S.%N
      path /var/log/kube-scheduler.log
      pos_file /var/log/es-kube-scheduler.log.pos
      tag kube-scheduler
    </source>

    # Example:
    # I1104 10:36:20.242766       5 rescheduler.go:73] Running Rescheduler
    <source>
      type tail
      format multiline
      multiline_flush_interval 5s
      format_firstline /^\w\d{4}/
      format1 /^(?<severity>\w)(?<time>\d{4} [^\s]*)\s+(?<pid>\d+)\s+(?<source>[^ \]]+)\] (?<message>.*)/
      time_format %m%d %H:%M:%S.%N
      path /var/log/rescheduler.log
      pos_file /var/log/es-rescheduler.log.pos
      tag rescheduler
    </source>

    # Example:
    # I0603 15:31:05.793605       6 cluster_manager.go:230] Reading config from path /etc/gce.conf
    <source>
      type tail
      format multiline
      multiline_flush_interval 5s
      format_firstline /^\w\d{4}/
      format1 /^(?<severity>\w)(?<time>\d{4} [^\s]*)\s+(?<pid>\d+)\s+(?<source>[^ \]]+)\] (?<message>.*)/
      time_format %m%d %H:%M:%S.%N
      path /var/log/glbc.log
      pos_file /var/log/es-glbc.log.pos
      tag glbc
    </source>

    # Example:
    # I0603 15:31:05.793605       6 cluster_manager.go:230] Reading config from path /etc/gce.conf
    <source>
      type tail
      format multiline
      multiline_flush_interval 5s
      format_firstline /^\w\d{4}/
      format1 /^(?<severity>\w)(?<time>\d{4} [^\s]*)\s+(?<pid>\d+)\s+(?<source>[^ \]]+)\] (?<message>.*)/
      time_format %m%d %H:%M:%S.%N
      path /var/log/cluster-autoscaler.log
      pos_file /var/log/es-cluster-autoscaler.log.pos
      tag cluster-autoscaler
    </source>

    # Logs from systemd-journal for interesting services.
    <source>
      type systemd
      filters [{ "_SYSTEMD_UNIT": "docker.service" }]
      pos_file /var/log/gcp-journald-docker.pos
      read_from_head true
      tag docker
    </source>

    <source>
      type systemd
      filters [{ "_SYSTEMD_UNIT": "kubelet.service" }]
      pos_file /var/log/gcp-journald-kubelet.pos
      read_from_head true
      tag kubelet
    </source>

    <source>
      type systemd
      filters [{ "_SYSTEMD_UNIT": "node-problem-detector.service" }]
      pos_file /var/log/gcp-journald-node-problem-detector.pos
      read_from_head true
      tag node-problem-detector
    </source>
  forward.input.conf: |-
    # Takes the messages sent over TCP
    <source>
      type forward
    </source>
  monitoring.conf: |-
    # Prometheus Exporter Plugin
    # input plugin that exports metrics
    <source>
      @type prometheus
    </source>

    <source>
      @type monitor_agent
    </source>

    # input plugin that collects metrics from MonitorAgent
    <source>
      @type prometheus_monitor
      <labels>
        host ${hostname}
      </labels>
    </source>

    # input plugin that collects metrics for output plugin
    <source>
      @type prometheus_output_monitor
      <labels>
        host ${hostname}
      </labels>
    </source>

    # input plugin that collects metrics for in_tail plugin
    <source>
      @type prometheus_tail_monitor
      <labels>
        host ${hostname}
      </labels>
    </source>
  output.conf: |-
    # Enriches records with Kubernetes metadata
    <filter kubernetes.**>
      type kubernetes_metadata
    </filter>

    <match **>
       type elasticsearch
       log_level info
       include_tag_key true
       host elasticsearch-logging
       port 9200
       logstash_format true
       # Set the chunk limits.
       buffer_chunk_limit 2M
       buffer_queue_limit 8
       flush_interval 5s
       # Never wait longer than 5 minutes between retries.
       max_retry_wait 30
       # Disable the limit on the number of retries (retry forever).
       disable_retry_limit
       # Use multiple threads for processing.
       num_threads 2
    </match>
metadata:
  name: fluentd-es-config-v0.1.0
  namespace: kube-system
  labels:
    addonmanager.kubernetes.io/mode: Reconcile
fluentd-es-ds.yaml
apiVersion: v1
kind: ServiceAccount
metadata:
  name: fluentd-es
  namespace: kube-system
  labels:
    k8s-app: fluentd-es
    kubernetes.io/cluster-service: "true"
    addonmanager.kubernetes.io/mode: Reconcile
---
kind: ClusterRole
apiVersion: rbac.authorization.k8s.io/v1beta1
metadata:
  name: fluentd-es
  labels:
    k8s-app: fluentd-es
    kubernetes.io/cluster-service: "true"
    addonmanager.kubernetes.io/mode: Reconcile
rules:
- apiGroups:
  - ""
  resources:
  - "namespaces"
  - "pods"
  verbs:
  - "get"
  - "watch"
  - "list"
---
kind: ClusterRoleBinding
apiVersion: rbac.authorization.k8s.io/v1beta1
metadata:
  name: fluentd-es
  labels:
    k8s-app: fluentd-es
    kubernetes.io/cluster-service: "true"
    addonmanager.kubernetes.io/mode: Reconcile
subjects:
- kind: ServiceAccount
  name: fluentd-es
  namespace: kube-system
  apiGroup: ""
roleRef:
  kind: ClusterRole
  name: fluentd-es
  apiGroup: ""
---
apiVersion: extensions/v1beta1
kind: DaemonSet
metadata:
  name: fluentd-es-v2.0.1
  namespace: kube-system
  labels:
    k8s-app: fluentd-es
    version: v2.0.1
    kubernetes.io/cluster-service: "true"
    addonmanager.kubernetes.io/mode: Reconcile
spec:
  template:
    metadata:
      labels:
        k8s-app: fluentd-es
        kubernetes.io/cluster-service: "true"
        version: v2.0.1
      # This annotation ensures that fluentd does not get evicted if the node
      # supports critical pod annotation based priority scheme.
      # Note that this does not guarantee admission on the nodes (#40573).
      annotations:
        scheduler.alpha.kubernetes.io/critical-pod: ''
    spec:
      serviceAccountName: fluentd-es
      containers:
      - name: fluentd-es
        image: gcr.io/google-containers/fluentd-elasticsearch:v2.0.1
        env:
        - name: FLUENTD_ARGS
          value: --no-supervisor -q
        resources:
          limits:
            memory: 500Mi
          requests:
            cpu: 100m
            memory: 200Mi
        volumeMounts:
        - name: varlog
          mountPath: /var/log
        - name: varlibdockercontainers
          mountPath: /var/lib/docker/containers
          readOnly: true
        - name: libsystemddir
          mountPath: /host/lib
          readOnly: true
        - name: config-volume
          mountPath: /etc/fluent/config.d
      nodeSelector:
        beta.kubernetes.io/fluentd-ds-ready: "true"
      terminationGracePeriodSeconds: 30
      volumes:
      - name: varlog
        hostPath:
          path: /var/log
      - name: varlibdockercontainers
        hostPath:
          path: /var/lib/docker/containers
      # It is needed to copy systemd library to decompress journals
      - name: libsystemddir
        hostPath:
          path: /usr/lib64
      - name: config-volume
        configMap:
          name: fluentd-es-config-v0.1.0
kibana-deployment.yaml
apiVersion: extensions/v1beta1
kind: Deployment
metadata:
  name: kibana-logging
  namespace: kube-system
  labels:
    k8s-app: kibana-logging
    kubernetes.io/cluster-service: "true"
    addonmanager.kubernetes.io/mode: Reconcile
spec:
  replicas: 1
  selector:
    matchLabels:
      k8s-app: kibana-logging
  template:
    metadata:
      labels:
        k8s-app: kibana-logging
    spec:
      containers:
      - name: kibana-logging

        # official image without logtrail:
        # image: docker.elastic.co/kibana/kibana:5.5.1

        # image with logtrail
        image: wardviaene/kibana-logtrail:5.5.1
        resources:
          # need more cpu upon initialization, therefore burstable class
          limits:
            cpu: 1000m
            memory: 2.5Gi
          requests:
            cpu: 100m
            memory: 2.5Gi
        env:
          - name: ELASTICSEARCH_URL
            value: http://elasticsearch-logging:9200
          # use this if you want to use proxy
          #- name: SERVER_BASEPATH
          #  value: /api/v1/proxy/namespaces/kube-system/services/kibana-logging
          - name: XPACK_MONITORING_ENABLED
            value: "false"
          - name: XPACK_SECURITY_ENABLED
            value: "false"
        ports:
        - containerPort: 5601
          name: ui
          protocol: TCP
kibana-service.yaml
apiVersion: v1
kind: Service
metadata:
  name: kibana-logging
  namespace: kube-system
  labels:
    k8s-app: kibana-logging
    kubernetes.io/cluster-service: "true"
    addonmanager.kubernetes.io/mode: Reconcile
    kubernetes.io/name: "Kibana"
spec:
  ports:
  - port: 5601
    protocol: TCP
    targetPort: ui
  selector:
    k8s-app: kibana-logging
  type: LoadBalancer
Authentication
- Currently, by default, X509 certificates are used to authenticate yourself to the kubernetes api-server
- These certificates were issued when your cluster was setup for the first time
- If you’re using RKE, minikube or kops, this was done for you
- In the first Kubernetes course, I showed you how to create new users by generating new certificates and signing them with the Certificate Authority that is used by Kubernetes
Alternative authentication methods
HTTP Basic authentication
- The kubernetes API server is based on HTTP, so one of the options is to use http basic authentication
- HTTP Basic authentication only requires us sending a username and password to the API server
- While this is very simple to do, a username-password combination is less secure and still difficult to maintain within Kubernetes
- To enable basic authentication, you can use a static password file on the Kubernetes master
- The path to this static password file needs to be passed to the apiserver as an argument:
- –basic-auth-file=/path/to/somefile
- The file needs to be formatted as:
password,user,uid,"group1,group2,group3"
- Basic auth has a few downsides:
- It’s currently supported for convenience while the kubernetes team is working on making the more secure methods easier to use
- To add a user (or change the password), the apiserver needs to be restarted
proxy
- Another way to handle authentication is to use a proxy
- When using a proxy, you can handlxe the authentication part yourself
- You can write your own authentication mechanism and provide the username, and groups to the kubernetes API once the user is authenticated
- This is a good solution if Kubernetes doesn’t support the authentication method you are looking for
- The proxy setup will need the following steps:
- The proxy needs a client certificate signed by the certificate authority that is passed to the api server using –requestheader-client-ca-file
- The proxy needs to do handle the authentication (using a form, basic auth, or another mechism)
- Once the user is authenticated, the proxy needs to forward the request to the kubernetes API server and set an HTTP header with the login
- This login http header is determined by a flag passed to the API server, for example: –requestheader-username-headers=X-Remote-User
- In this example, the proxy need to set the X-Remote-User after authentication
- –requestheader-group-headers=X-Remote-Group can be used as an argument to set the group header
- –requestheader-extra-headers-prefix=X-Remote-Extra- allows you to set extra headers with extra information about the user
OpenID
- Another (better) alternative is to use OpenID Connect tokens
- OpenID Connect is built on top of OAuth2
- It allows you to securely authenticate and then receive an ID Token
- This ID Token can be verified whether it really originated from the authentication server, because it’s signed (using HMAC SHA256 or RSA)
- This token is a JSON Web Token (JWT)
- JWT contains known fields like username and optionally groups
- Once this token is obtained it can be used as credential to authenticate to the apiserver
- You can pass –token=<yourtoken> when executing kubectl commands
- kubectl can also automatically renew your token_id when it expires
- Although this doesn’t work with all identity providers
- Using this token, you can also authenticate to the Kubernetes UI
- To make this easier, I created a reverse proxy that can authenticate you using OpenID Connect and will then pass your token to the UI
Auth0
- Setup Identity Provider (auth0 account)
- Create auth0 client for Kubernetes
- Setup cluster with oidc (OpenID Connect) using kops edit
- Deploy authentication server (for UI proxy + to hand out bearer tokens)
- Change variables to match auth0
- Create DNS record for auth server
- Try logging in to the UI through authentication server
auth0-secrets.yml
apiVersion: v1
kind: Secret
metadata:
  name: auth0-secrets
type: Opaque
data:
  AUTH0_CLIENT_SECRET: # enter the auth0 secret here
auth0-deployment.yml
apiVersion: extensions/v1beta1
kind: Deployment
metadata:
  name: kubernetes-auth-server
spec:
  replicas: 1
  template:
    metadata:
      labels:
        app: kubernetes-auth-server
    spec:
      containers:
      - name: kubernetes-auth-server
        image: wardviaene/kubernetes-auth-server:1.0.1
        imagePullPolicy: Always
        ports:
        - name: app-port
          containerPort: 3000
        env:
          - name: AUTH0_CLIENT_ID
            value:  # change into your client id
          - name: AUTH0_DOMAIN
            value: newtechacademy.eu.auth0.com # change into your domain
          - name: AUTH0_CALLBACK_URL
            value: http://authserver.kubernetes.newtech.academy/callback # change into your callback url
          - name: AUTH0_API_ID
            value: https://newtechacademy.eu.auth0.com/userinfo # change into your identifier
          - name: AUTH0_CONNECTION
            value: Username-Password-Authentication # auth0 user database connection
          - name: KUBERNETES_UI_HOST
            value: api.kubernetes.newtech.academy
          - name: APP_HOST
            value: authserver.kubernetes.newtech.academy
          - name: AUTH0_CLIENT_SECRET
            valueFrom:
              secretKeyRef:
                name: auth0-secrets
                key: AUTH0_CLIENT_SECRET
auth0-service.yml
apiVersion: v1
kind: Service
metadata:
  name: kubernetes-auth-server
spec:
  ports:
  - port: 80
    targetPort: app-port
    protocol: TCP
  selector:
    app: kubernetes-auth-server
  type: LoadBalancer
Authorization
- After authentication, authorization controls what the user can do, where does the user have access to
- The access controls are implemented on an API level (kube-apiserver)
- When an API request comes in (e.g. when you enter kubectl get nodes), it will be checked to see whether you have access to execute this command
- There are multiple authorization module available:
- Node: a special purpose authorization mode that authorizes API requests made by kubelets
- ABAC: attribute-based access control
- Access rights are controlled by policies that combine attributes
- e.g. user “alice” can do anything in namespace “marketing”
- ABAC does not allow very granular permission control
- RBAC: role based access control
- Regulates access using roles
- Allows admins to dynamically configure permission policies
- Beta since kubernetes 1.6 but soon to be stable
- Webhook: sends authorization request to an external REST interface
- Interesting option if you want to write your own authorization server
- You can parse the incoming payload (which is JSON) and reply with access granted or access denied
- To enable an authorization mode, you need to pass –authorization- mode= to the API server at startup
- For example, to enable RBAC, you pass —authorization-mode=RBAC
- When using kops, you can create a cluster with the flag –authorization
- By default (when not specifying the flag), you are allowing everything (same as specifying AlwaysAllow)
- This might change in the future
- When specifying –authorization RBAC, a cluster will be created using RBAC
- By default (when not specifying the flag), you are allowing everything (same as specifying AlwaysAllow)
- If your cluster is already setup with kops, you can use kops edit cluster and change these lines:
kubeAPIServer: authorization
Mode: RBAC
- If you’re using minikube, you can add a parameter when starting minikube:
$ minikube start —-extra-config=apiserver.Authorization.Mode=RBAC
- If you’re using another tool to setup the cluster, you’ll have to refer to the documentation of that tool
- If you set up the cluster manually, you have to take a look at the boot scripts (e.g. systemd)
RBAC
- You can add RBAC resources with kubectl to grant permissions
- You first describe them in yaml format, then apply them to the cluster
- First you define a role, then you can assign users/groups to that role
- You can create roles limited to a namespace, or you can create roles where the access applies to all namespaces
- The different kinds of resources I’m going to show you next are:
- Role (single namespace) and ClusterRole (cluster-wide)
- RoleBinding (single namespace) and ClusterRoleBinding (cluster-wide)
- RBAC Role granting read access to pods and secrets within default namespace
kind: Role
apiVersion: rbac.authorization.k8s.io/v1
metadata:
  namespace: default
  name: pod-reader
rules:
- apiGroups: [""]
  resources: [“pods”, “secrets”]
  verbs: ["get", "watch", "list"]
- If you rather want to create a role that spans all namespaces, you can use ClusterRole
kind: ClusterRole
apiVersion: rbac.authorization.k8s.io/v1
metadata:
  name: pod-reader-clusterwide
rules:
- apiGroups: [""]
  resources: [“pods”, “secrets”]
  verbs: ["get", "watch", "list"]
- Next step is to assign users to the newly created role
kind: RoleBinding
apiVersion: rbac.authorization.k8s.io/v1
metadata:
  name: read-pods
  namespace: default
subjects:
- kind: User
  name: bob
  apiGroup: rbac.authorization.k8s.io
roleRef:
  kind: Role
  name: pod-reader
  apiGroup:  rbac.authorization.k8s.io
- If you need to assign a user to a cluster-wide role, you need to use ClusterRoleBinding
kind: ClusterRoleBinding
apiVersion: rbac.authorization.k8s.io/v1
metadata:
  name: read-pods
subjects:
- kind: User
  name: alice
  apiGroup: rbac.authorization.k8s.io
roleRef:
  kind: Role
  name: pod-reader-clusterwide
  apiGroup: rbac.authorization.k8s.io
RBAC Role
- A more complex role:
kind: ClusterRoleBinding
apiVersion: rbac.authorization.k8s.io/v1
metadata:
  name: more-complex-role
rules:
- apiGroups: [""]
  resources: [“configmaps”, “secrets”, “nodes”]
  verbs: ["get", "list", "watch"]
- apiGroups: ["batch"]
  resources: ["jobs"]
  verbs: ["get", "list", "watch", "create", "update", "patch", "delete"]
- apiGroups: [““] resources: [“pods”]
  verbs: ["get", "list", "watch", "create", "update", "patch", “delete"]
- apiGroups: ["extensions", "apps"]
  resources: ["deployments"]
  verbs: ["get", "list", "watch", "create", "update", "patch", "delete"]
Pre-Defined RBAC Roles
- You don’t need to create your own complex roles, you can also use one of the predefined ones:
| Role name | Description |
| cluster-admin | super-user access. Can be used with ClusterRoleBinding (superuser access on the cluster) or with RoleBinding to limit access within a namespace |
| admin | admin access, intended to be used only with RoleBinding. Has read/write access within the namespace, but can’t change quotas |
| edit | read/write access to most objects within a namespace, but can’t view/ create new roles or rolebindings |
| view | read access, but can’t see any secrets, roles, or rolebindings |
- Superuser example:
kind: RoleBinding
apiVersion: rbac.authorization.k8s.io/v1
metadata:
  name: admins
  namespace: default
subjects:
- kind: User
  name: bob
  apiGroup: rbac.authorization.k8s.io
roleRef:
  kind: Role
  name: cluster-admin
  apiGroup: rbac.authorization.k8s.io
Packaging Helm
- Helm is the package manager for Kubernetes
- Helm helps you to manage Kubernetes applications
- Helm is maintained by the CNCF - The Cloud Native Computing Foundation (together with Kubernetes, fluentd, linkerd, and others)
- Helm was started by Google and Deis
- Deis provides a PaaS on Kubernetes and was bought by Microsoft in April 2017
Charts
- Helm uses a packaging format called charts
- A chart is a collection of files that describe a set of Kubernetes resources
- A single chart can deploy an app, a piece of software or a database for example
- It can have dependencies, e.g. to install wordpress chart, you need a mysql chart
- You can write your own chart to deploy your application on Kubernetes using helm
- Charts use templates that are typically developed by a package maintainer
- They will generate yaml files that Kubernetes understands
- You can think of templates as dynamic yaml files, which can contain logic and variables
- This is an example of a template within a chart:
apiVersion: v1
kind: ConfigMap
metadata:
  name: {{ .Release.Name }}-configmap
data:
  myvalue: "Hello World"
  drink: {{ .Values.favoriteDrink }}
- The
favoriteDrinkvalue can then be overridden by the user when running helm install - Overriding values can be useful to make sure the app is configured in a way you want
| Parameter | Description | Default |
| mysqlRootPassword | Password for the root user. | nil |
| mysqlUser | Username of new user to create. | nil |
| mysqlPassword | Password for the new user. | nil |
| mysqlDatabase | Name for new database to create | nil |
| persistence.enabled | Create a volume to store data | TRUE |
| persistence.size | Size of persistent volume claim | 8Gi RW |
| persistence.storageClass | Type of persistent volume claim | nil (uses alpha storage class annotation) |
The Job Resource
- Up until now we’ve always seen pods as long running services that don’t stop (like webservers)
- You can also schedule pods as Jobs rather than with a ReplicationController / ReplicaSet
- With a ReplicationController / ReplicaSet a pod will be indefinitely restarted if the pod stops
- With the Job resource, pods are expected to run a specific task and then exit
- There are 3 main types of jobs:
- Non parallel Jobs
- Parallel Jobs with fixed completion count
- Parallel Jobs with work queue
- Non Parallel jobs:
- The Job resource will monitor the job, and restart the pod if it fails or gets deleted
- You can still influence this with a restartPolicy attribute
- When the pod successfully completes, the job itself will be completed
- An example of a non-parallel job:
apiVersion: batch/v1
kind: Job
metadata:
  name: pi
spec:
  template:
    metadata:
      name: pi
    spec:
      containers:
      - name: pi
        image: perl
        command: ["perl", "-Mbignum=bpi", "-wle", "print bpi(2000)"]
      restartPolicy: Never
- Parallel jobs with a fixed completion count:
- In this case a Job can run multiple pods in parallel
- You specify a fixed completion count
- The job is complete when completion count == successful exited pods
- To use this, add “completions: ” to the specification of your job
- Parallel jobs with a work queue:
- In this case the pods should coordinate with themselves (or an external service) to determine what each should work on
- When any pod terminates with success, no more pods are created and the job is considered completed
- This because the pods should know themselves when all the work is done, at the point when a pod terminates with success, all pods should terminate, because the job is completed
Scheduling Using the crontab resource
- A Cron Job can schedule Job resources based on time
- Once at a specified time
- e.g. Run this Job once, this night at 3 AM
- Recurrently
- e.g. Run this Job every night at 3 AM
- Once at a specified time
- CronJob is comparable with crontab in Linux/Unix systems
- CronJob Schedule format (Cron notation, see also https://en.wikipedia.org/wiki/Cron)
┌───────────── minute (0 - 59) │ ┌───────────── hour (0 - 23) │ │ ┌───────────── day of month (1 - 31) │ │ │ ┌───────────── month (1 - 12) │ │ │ │ ┌───────────── day of week (0 - 6) (Sunday to Saturday; 7 is also Sunday on some systems) │ │ │ │ │ │ │ │ │ │ │ │ │ │ │ * * * * *
Example 1: Every night at 3:20 AM
20 3 * * *
Example 2: Every 15 minutes
*/15 * * * *
CronJob
- An example of a cronjob:
apiVersion: batch/v2alpha1
kind: CronJob
metadata:
  name: hello
spec:
  schedule: "25 3 * * *"
  jobTemplate:
    spec:
      template:
        spec:
          containers:
          - name: my-cronjob
            image: busybox
            args:
            - /bin/sh
            - -c
            - echo This command runs every night at 3:25 AM
          restartPolicy: OnFailure
Deploying on Kubernetes Using Spinnaker
- Spinnaker is a Continuous Delivery platform
- It can automate deployments on different cloud providers:
- AWS EC2, Google Compute/Container/App engine, Azure, Openstack, and Kubernetes
- Works only for immutable (cloud-native) apps
- Created at Netflix
- Also integrates with Continuous Integration tools (Jenkins, Travis), with monitoring tools, and provides different deployment strategies
- Spinnaker has 2 core sets of features:
- Cluster Management:
- View and manage your cluster resources in the cloud (or in this case, within Kubernetes)
- Deployment Management:
- Create and manage continuous delivery workflows
- This is where you create the delivery pipeline
- Cluster Management:
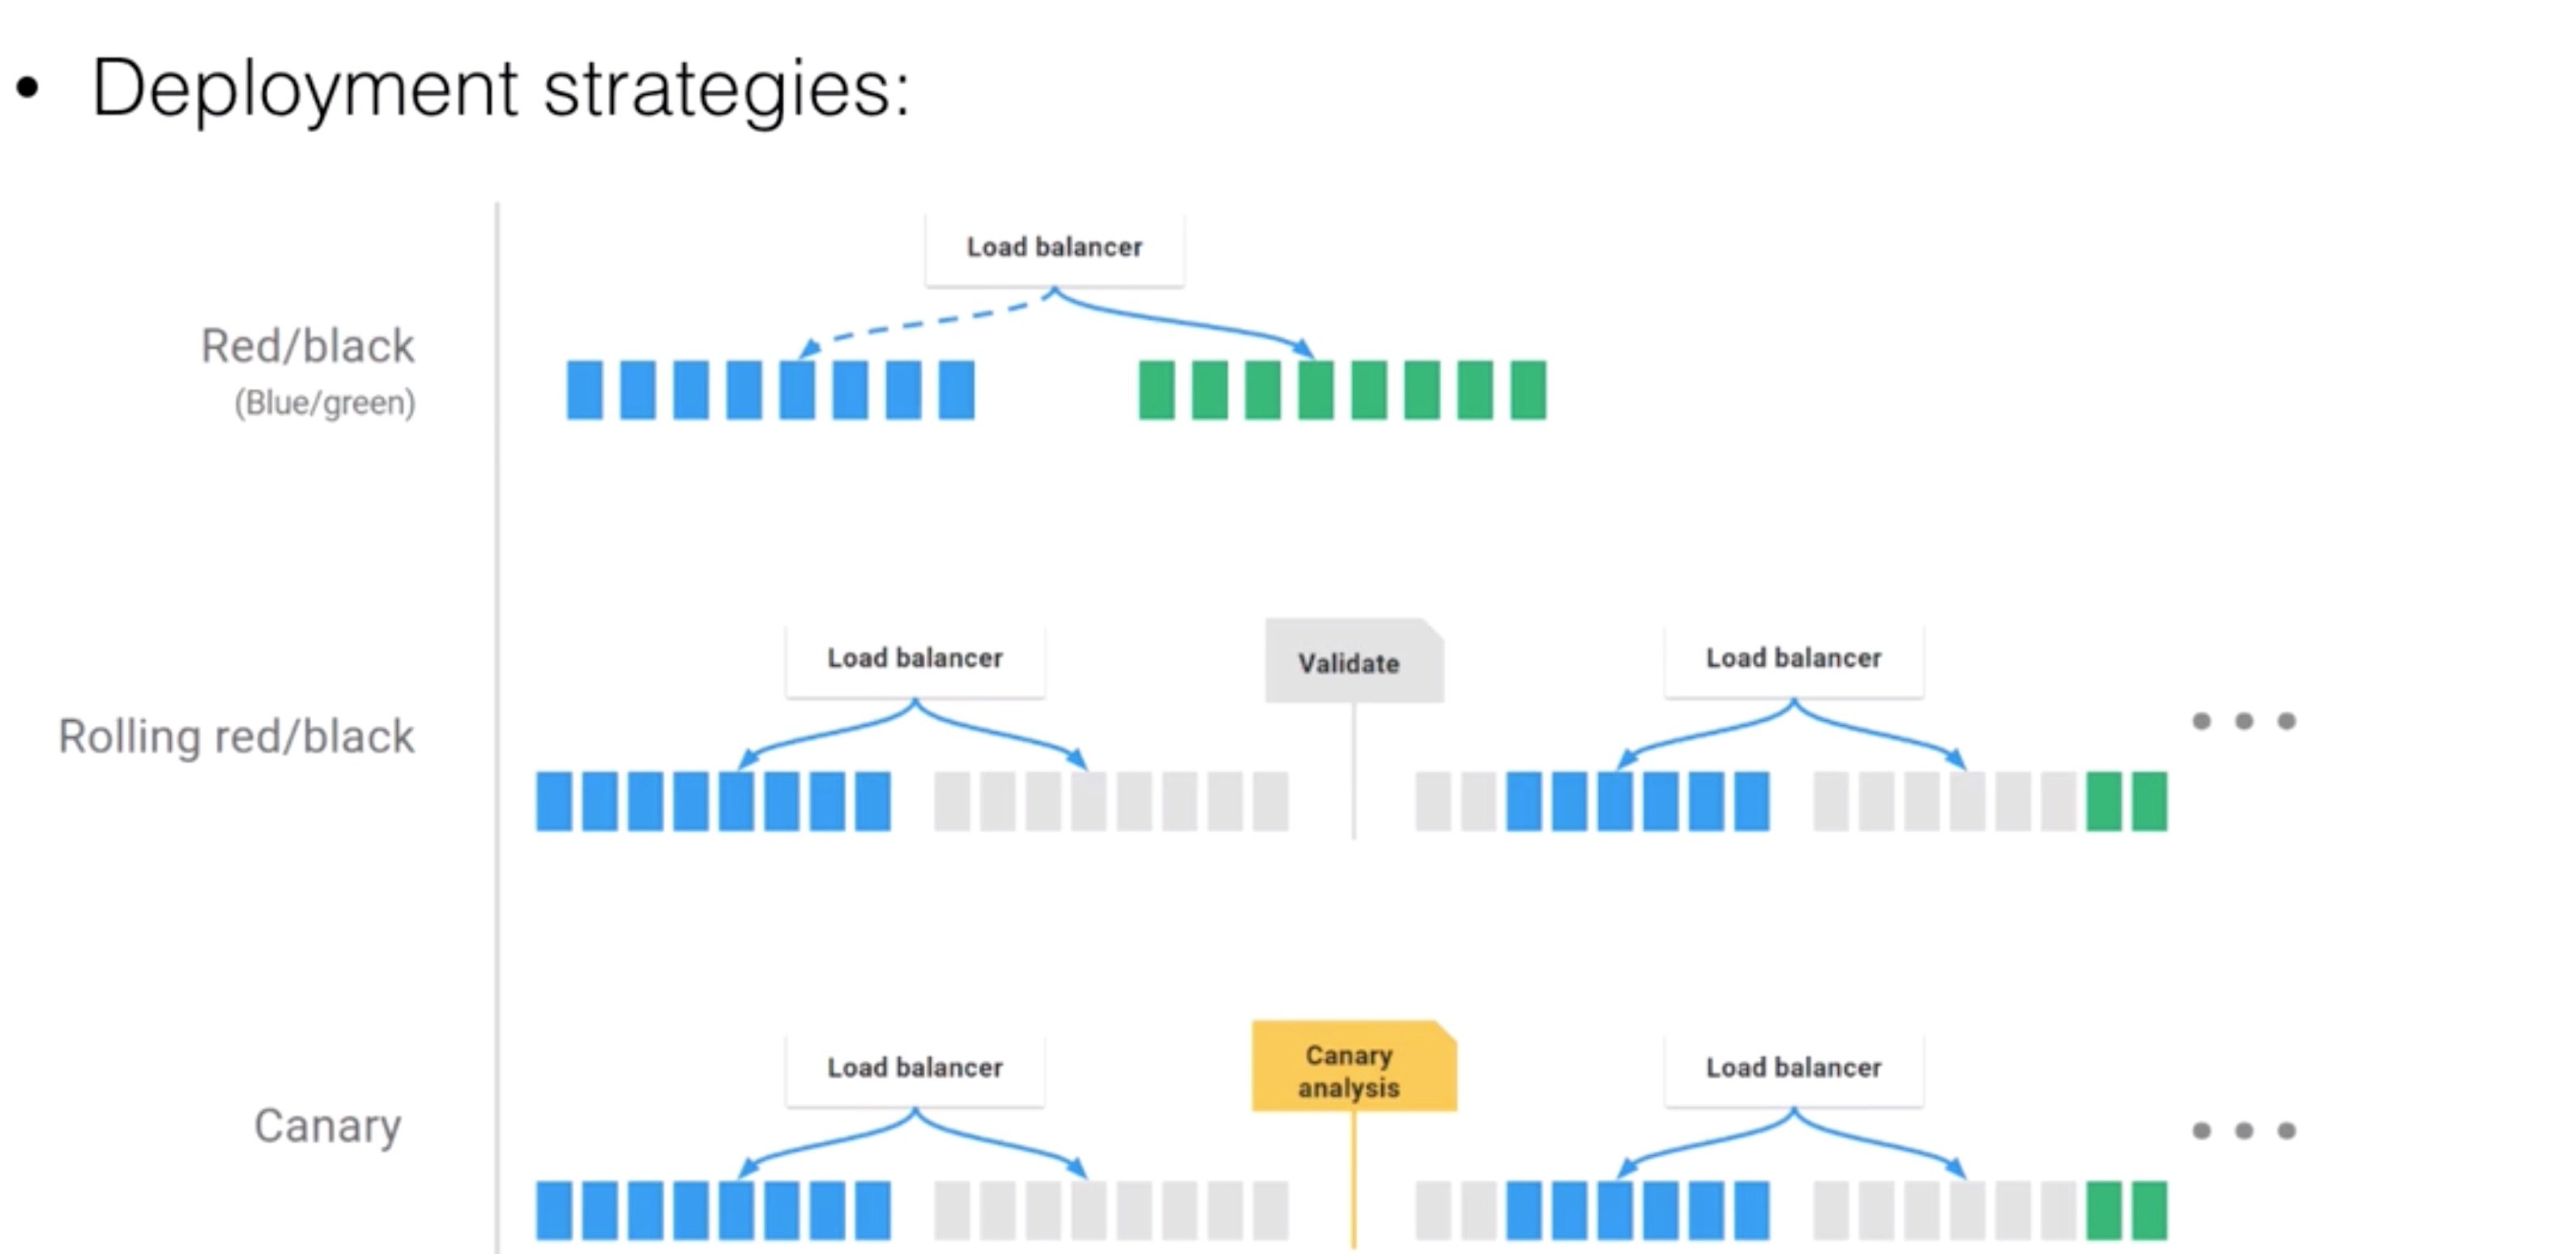
- Deployment strategies: Source: https://www.spinnaker.io/concepts
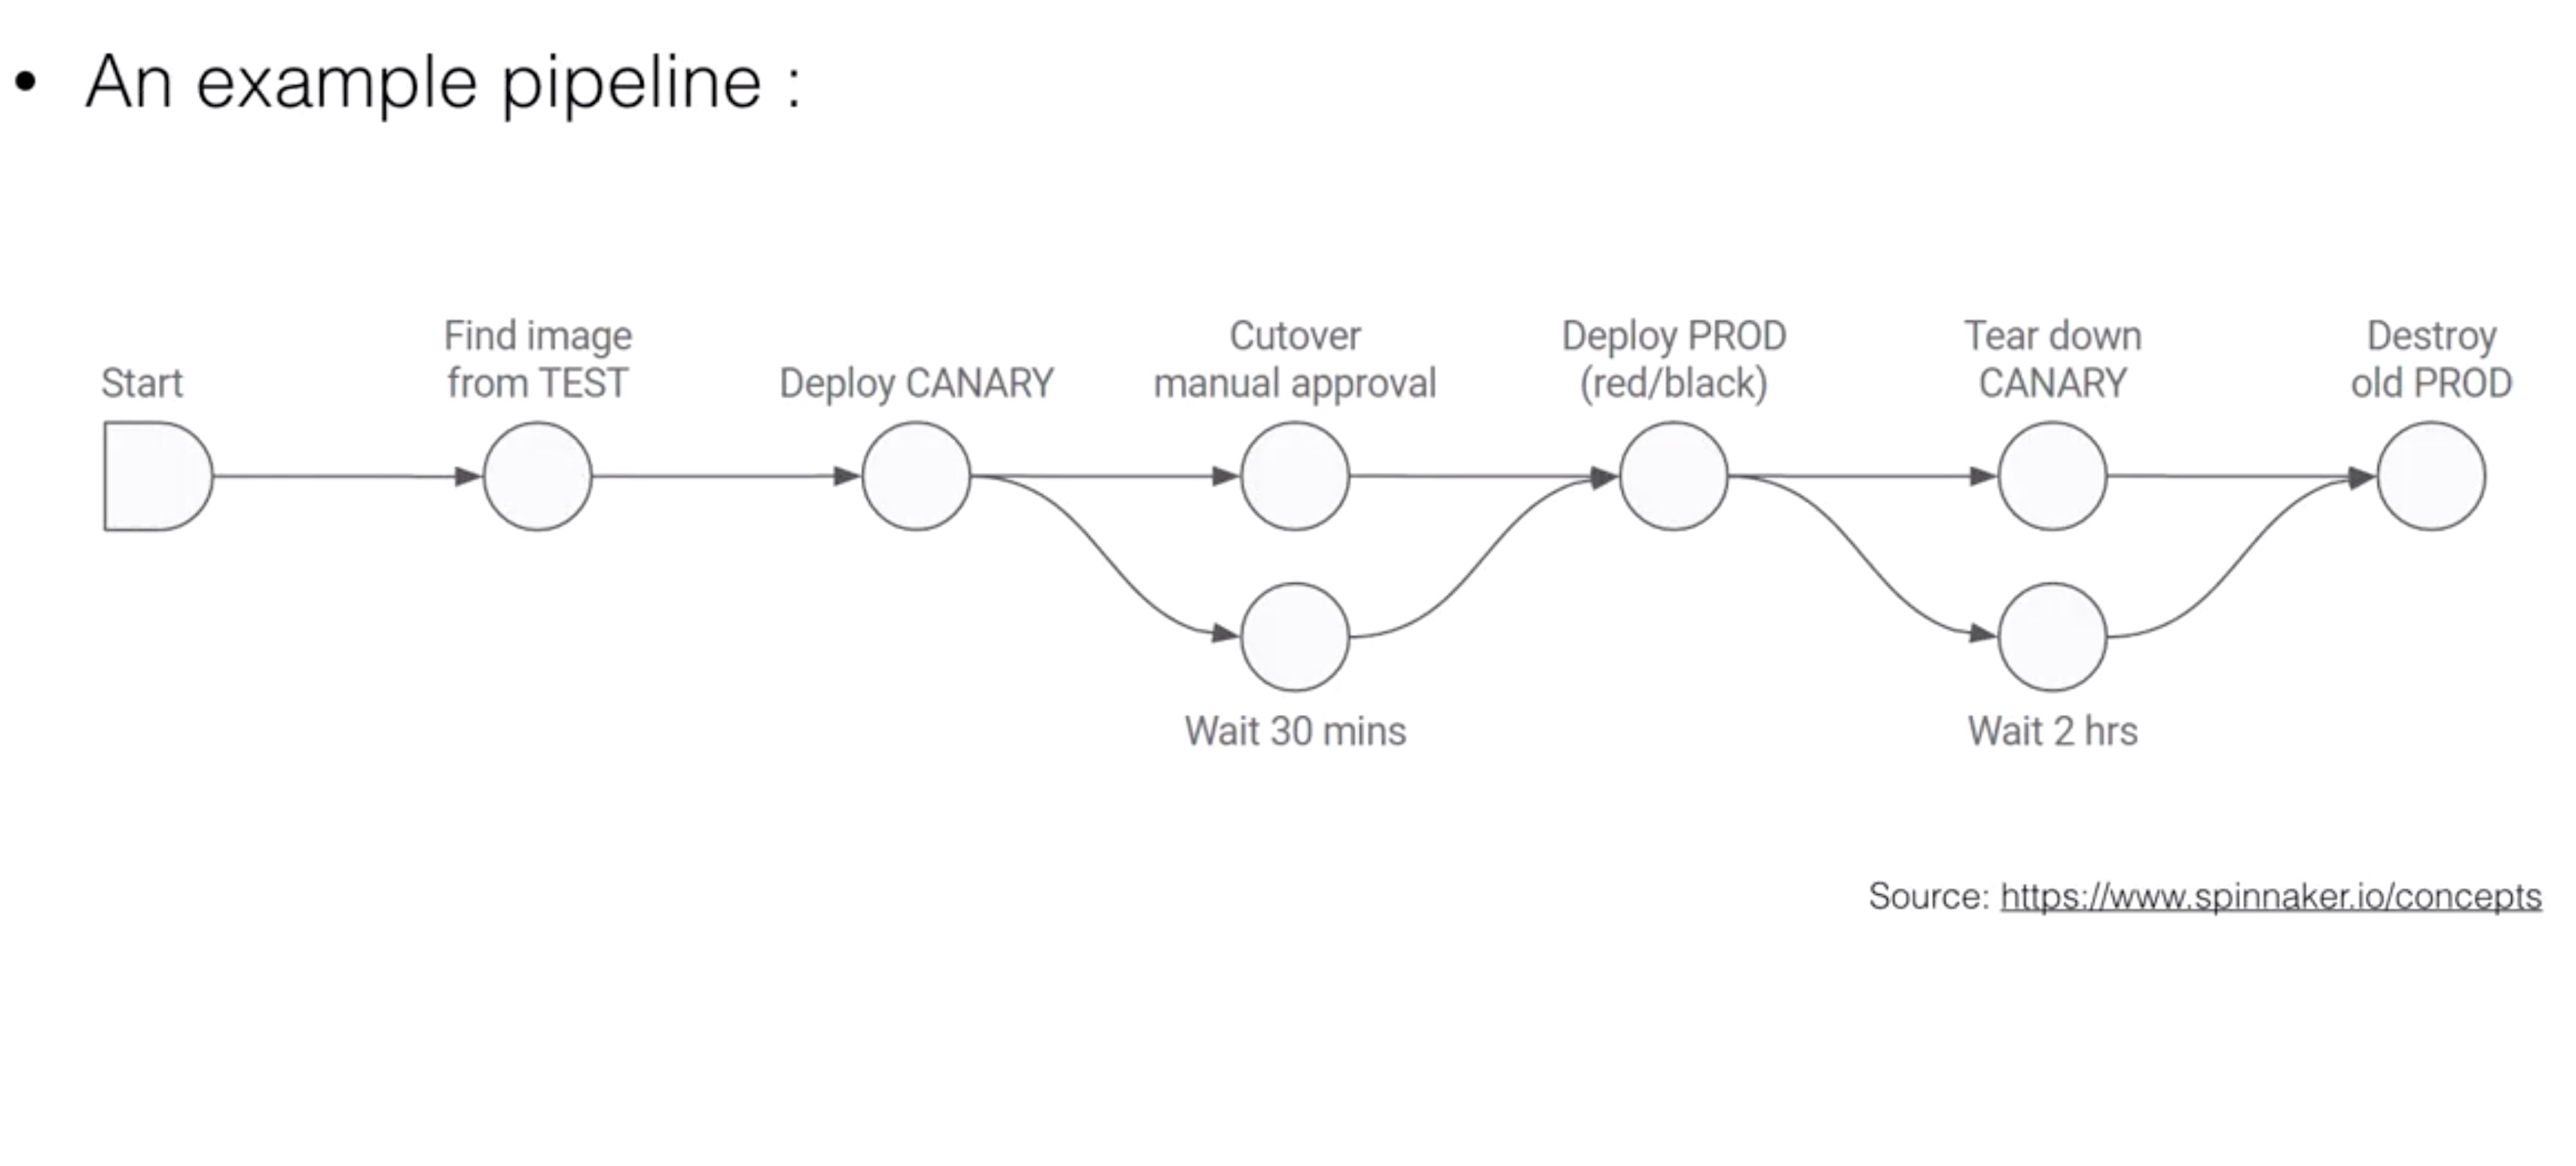
- An example pipeline : Source: https://www.spinnaker.io/concepts
Terminology
- The terminology in Spinnaker is a bit different than the terminology used in Kubernetes:
- Account: maps to a credential able to authenticate against Kubernetes, and docker registries where your images are stored
- Instance: maps to a Kubernetes pod
- Server Group: maps to a Replica Set
- Cluster: a “Spinnaker deployment” on Kubernetes
- Spinnaker uses its own orchestration and is different from the Deployment on Kubernetes
- Load Balancer: maps to a Kubernetes Service
Installation
spinnaker.yaml
# Define which registries and repositories you want available in your
# Spinnaker pipeline definitions
# For more info visit:
#   http://www.spinnaker.io/v1.0/docs/target-deployment-configuration#section-docker-registry

# Configure your Docker registries here
accounts:
- name: dockerhub
  address: https://index.docker.io
  repositories:
    - library/alpine
    - library/ubuntu
    - library/centos
    - library/nginx
    - wardviaene/spinnaker-node-demo
# - name: gcr
#   address: https://gcr.io
#   username: _json_key
#   password: '<INSERT YOUR SERVICE ACCOUNT JSON HERE>'
#   email: 1234@5678.com

# Settings for notifications via email
# For more info visit:
#   http://www.spinnaker.io/docs/notifications-and-events-guide#section-email
mail:
  enabled: false
  host: smtp.example.org
  username: admin
  password: admin
  fromAddress: spinnaker@example.org
  port: 25

# Images for each component
images:
  clouddriver: gcr.io/spinnaker-marketplace/clouddriver:0.5.0-72
  echo: gcr.io/spinnaker-marketplace/echo:0.4.0-72
  deck: gcr.io/spinnaker-marketplace/deck:1.3.0-72
  igor: gcr.io/spinnaker-marketplace/igor:0.4.0-72
  orca: gcr.io/spinnaker-marketplace/orca:0.5.0-72
  gate: gcr.io/spinnaker-marketplace/gate:0.5.0-72
  front50: gcr.io/spinnaker-marketplace/front50:0.4.1-72
  rosco: gcr.io/spinnaker-marketplace/rosco:0.4.0-72

# Change this if youd like to expose Spinnaker outside the cluster
deck:
  host: localhost
  port: 9000
  protocol: http

gate:
  allowedOriginsPattern: '^https?://(?:localhost|127.0.0.1|[^/]+\.example\.com)(?::[1-9]\d*)?/?$'

# Bucket to use when storing config data in S3 compatible storage
storageBucket: demo-spinnaker

# Change service type for UI service
serviceType: ClusterIP

# Resources to provide to each of
# the Spinnaker components
resources:
  limits:
    cpu: 1000m
    memory: 1280Mi
  requests:
    cpu: 1000m
    memory: 1280Mi

# Redis password to use for the in-cluster redis service
# Redis is not exposed publically
redis:
  redisPassword: password

# Minio access/secret keys for the in-cluster S3 usage
# Minio is not exposed publically
minio:
  enabled: true
  imageTag: RELEASE.2016-11-26T02-23-47Z
  serviceType: ClusterIP
  accessKey: spinnakeradmin
  secretKey: spinnakeradmin

gcs:
  enabled: false
  project: my-project-name
  jsonKey: '<INSERT CLOUD STORAGE JSON HERE>'

# Configuration for the Jenkins instance that is attached to the
# igor component of Spinnaker. For more info about the Jenkins integration
# with Spinnaker, visit:
#   http://www.spinnaker.io/docs/jenkins-script-execution-stage
jenkins:
  Master:
    ImageTag: 2.62
    Cpu: "500m"
    Memory: "512Mi"
    ServiceType: ClusterIP
    CustomConfigMap: true
    InstallPlugins:
      - kubernetes:0.11
      - workflow-aggregator:2.5
      - workflow-job:2.11
      - credentials-binding:1.12
      - git:3.2.0

  Agent:
    Image: viglesiasce/spinnaker-jenkins-agent
    ImageTag: v0.2.0
    Cpu: "500m"
    Memory: "512Mi"
- Install with
helm install --name spinnaker -f spinnaker.yaml stable/spinnaker
Linkerd
- On Kubernetes you can run a lot of microservices on one cluster
- It can quickly become difficult to manage the endpoints of all the different services that make up an application
within the cluster:
- Service discovery in Kubernetes is pretty limited
- Routing is often on a round-robin based
- There is no failure handling
- Except removing pods that fail their healthcheck
- It’s also difficult to visualize the different services
- HTTP APIs can be very basic and there’s no failure handling:
- What happens when app A sends an HTTP GET request to app B, but B is temporary not available?
- If not written in the APP, the request will just fail and will not retried
- Linkerd can solve these issues for us, and provide us many more features
- Linkerd is a transparent proxy that adds
- service discovery
- routing
- Latency aware load balancing
- It can shift traffic to do canary deployments
- failure handling
- Using retries, deadlines and circuit braking
- and visibility
- Using web UIs
- How do the pods find linkerd?
node-name-test.yml
apiVersion: v1
kind: Pod
metadata:
  name: node-name-test
spec:
  restartPolicy: Never
  containers:
  - image: gcr.io/google_containers/busybox
    command: [ "sh", "-c" ]
    args:
      - while true; do
          echo -en '\n';
          nslookup $MY_NODE_NAME;
          echo -en '\n';
          printenv MY_NODE_NAME MY_POD_NAME MY_POD_NAMESPACE;
          printenv MY_POD_IP MY_POD_SERVICE_ACCOUNT;
          sleep 60;
        done;
    name: node-name
    env:
    - name: MY_NODE_NAME
      valueFrom:
        fieldRef:
          fieldPath: spec.nodeName
    - name: MY_POD_NAME
      valueFrom:
        fieldRef:
          fieldPath: metadata.name
    - name: MY_POD_NAMESPACE
      valueFrom:
        fieldRef:
          fieldPath: metadata.namespace
    - name: MY_POD_IP
      valueFrom:
        fieldRef:
          fieldPath: status.podIP
    - name: MY_POD_SERVICE_ACCOUNT
      valueFrom:
        fieldRef:
          fieldPath: spec.serviceAccountName
- hello-world.yml implementation:
spec:
  dnsPolicy: ClusterFirst
  containers:
  - name: service
    image: buoyantio/helloworld:0.1.4
    env:
    - name: NODE_NAME
      valueFrom:
        fieldRef:
          fieldPath: spec.nodeName
    - name: POD_IP
      valueFrom:
        fieldRef:
          fieldPath: status.podIP
    - name: http_proxy
      value: $(NODE_NAME):4140
    args:
    - "-addr=:7777"
    - "-text=Hello"
    - "-target=world"
    ports:
    - name: service
      containerPort: 7777
Install linkerd
linkerd.yml
# runs linkerd in a daemonset, in linker-to-linker mode
---
apiVersion: v1
kind: ConfigMap
metadata:
  name: l5d-config
data:
  config.yaml: |-
    admin:
      ip: 0.0.0.0
      port: 9990

    namers:
    - kind: io.l5d.k8s
      experimental: true
      host: localhost
      port: 8001

    telemetry:
    - kind: io.l5d.prometheus
    - kind: io.l5d.recentRequests
      sampleRate: 0.25

    usage:
      orgId: linkerd-examples-daemonset

    routers:
    - protocol: http
      label: outgoing
      dtab: |
        /srv        => /#/io.l5d.k8s/default/http;
        /host       => /srv;
        /svc        => /host;
        /host/world => /srv/world-v1;
      interpreter:
        kind: default
        transformers:
        - kind: io.l5d.k8s.daemonset
          namespace: default
          port: incoming
          service: l5d
      servers:
      - port: 4140
        ip: 0.0.0.0
      service:
        responseClassifier:
          kind: io.l5d.http.retryableRead5XX

    - protocol: http
      label: incoming
      dtab: |
        /srv        => /#/io.l5d.k8s/default/http;
        /host       => /srv;
        /svc        => /host;
        /host/world => /srv/world-v1;
      interpreter:
        kind: default
        transformers:
        - kind: io.l5d.k8s.localnode
      servers:
      - port: 4141
        ip: 0.0.0.0
---
apiVersion: extensions/v1beta1
kind: DaemonSet
metadata:
  labels:
    app: l5d
  name: l5d
spec:
  template:
    metadata:
      labels:
        app: l5d
    spec:
      volumes:
      - name: l5d-config
        configMap:
          name: "l5d-config"
      containers:
      - name: l5d
        image: buoyantio/linkerd:1.2.0
        env:
        - name: POD_IP
          valueFrom:
            fieldRef:
              fieldPath: status.podIP
        args:
        - /io.buoyant/linkerd/config/config.yaml
        ports:
        - name: outgoing
          containerPort: 4140
          hostPort: 4140
        - name: incoming
          containerPort: 4141
        - name: admin
          containerPort: 9990
        volumeMounts:
        - name: "l5d-config"
          mountPath: "/io.buoyant/linkerd/config"
          readOnly: true

      - name: kubectl
        image: buoyantio/kubectl:v1.4.0
        args:
        - "proxy"
        - "-p"
        - "8001"
---
apiVersion: v1
kind: Service
metadata:
  name: l5d
spec:
  selector:
    app: l5d
  type: LoadBalancer
  ports:
  - name: outgoing
    port: 4140
  - name: incoming
    port: 4141
  - name: admin
    port: 9990
kubectl apply -f linkerd.yml
INGRESS_LB=$(kubectl get svc l5d -o jsonpath="{.status.loadBalancer.ingress[0].*}")
echo http://$INGRESS_LB:9990
Visualization:
linkerd-viz.yml
---
apiVersion: v1
kind: ReplicationController
metadata:
  name: linkerd-viz
  labels:
    name: linkerd-viz
spec:
  replicas: 1
  selector:
    name: linkerd-viz
  template:
    metadata:
      labels:
        name: linkerd-viz
    spec:
      containers:
      - name: linkerd-viz
        image: buoyantio/linkerd-viz:0.1.5
        args: ["k8s"]
        imagePullPolicy: Always
        env:
        - name: PUBLIC_PORT
          value: "3000"
        - name: STATS_PORT
          value: "9191"
        - name: SCRAPE_INTERVAL
          value: "30s"
        ports:
        - name: grafana
          containerPort: 3000
        - name: prometheus
          containerPort: 9191

      - name: kubectl
        image: buoyantio/kubectl:v1.4.0
        args:
        - "proxy"
        - "-p"
        - "8001"
---
apiVersion: v1
kind: Service
metadata:
  name: linkerd-viz
  labels:
    name: linkerd-viz
spec:
  type: LoadBalancer
  ports:
  - name: grafana
    port: 80
    targetPort: 3000
  - name: prometheus
    port: 9191
    targetPort: 9191
  selector:
    name: linkerd-viz
kubectl apply -f linkerd-viz.yml
VIZ_INGRESS_LB=$(kubectl get svc linkerd-viz -o jsonpath="{.status.loadBalancer.ingress[0].*}")
echo http://$VIZ_INGRESS_LB
Example app
hello-world.yml
---
apiVersion: v1
kind: ReplicationController
metadata:
  name: hello
spec:
  replicas: 3
  selector:
    app: hello
  template:
    metadata:
      labels:
        app: hello
    spec:
      dnsPolicy: ClusterFirst
      containers:
      - name: service
        image: buoyantio/helloworld:0.1.4
        env:
        - name: NODE_NAME
          valueFrom:
            fieldRef:
              fieldPath: spec.nodeName
        - name: POD_IP
          valueFrom:
            fieldRef:
              fieldPath: status.podIP
        - name: http_proxy
          value: $(NODE_NAME):4140
        args:
        - "-addr=:7777"
        - "-text=Hello"
        - "-target=world"
        ports:
        - name: service
          containerPort: 7777
---
apiVersion: v1
kind: Service
metadata:
  name: hello
spec:
  selector:
    app: hello
  clusterIP: None
  ports:
  - name: http
    port: 7777
---
apiVersion: v1
kind: ReplicationController
metadata:
  name: world-v1
spec:
  replicas: 3
  selector:
    app: world-v1
  template:
    metadata:
      labels:
        app: world-v1
    spec:
      dnsPolicy: ClusterFirst
      containers:
      - name: service
        image: buoyantio/helloworld:0.1.4
        env:
        - name: POD_IP
          valueFrom:
            fieldRef:
              fieldPath: status.podIP
        - name: TARGET_WORLD
          value: world
        args:
        - "-addr=:7778"
        ports:
        - name: service
          containerPort: 7778
---
apiVersion: v1
kind: Service
metadata:
  name: world-v1
spec:
  selector:
    app: world-v1
  clusterIP: None
  ports:
  - name: http
    port: 7778
kubectl create -f hello-world.yml
http_proxy=$INGRESS_LB:4140 curl -s http://hello
Examples are from https://github.com/linkerd/linkerd-examples/tree/master/k8s-daemonset/k8s/
Federation
- Federation is still in alpha stage so use at own risk. One project worth following to use federation is the Kubernetes Multi Cluster (Federation v2) which targets 2018 Q4 for a beta release (https://github.com/kubernetes/community/tree/master/sig-multicluster).
- Federation can be used to manage multiple clusters:
- You can sync resources across clusters
- The same deployment version will run on cluster A and cluster B
- You can do cross cluster discovery
- One DNS record / Virtual IP (VIP) for a resource spanning multiple clusters
- Can help to achieve High Availability (spreading load across clusters, enabling failover between clusters)
- You can sync resources across clusters
- A few reasons to run multiple clusters:
- Lower latency for customers (bringing app geographically closer to customer)
- Fault isolation when physical hardware (or a rack / full zone) fails
- Scale beyond the limitations of one cluster
- Run clusters in a hybrid cloud environment
- On cluster can run on-premises, with a failover to cloud
Monitoring with Prometheus
- Prometheus is an open source monitoring and alerting tool
- You can compare it to the heapster + grafana setup from the first Kubernetes course, but Prometheus can do a lot more
- It has been built at Soundcloud
- Many companies and organizations have adopted it since
- It is now a standalone and open source project
- Prometheus joined the Cloud Native Computing Foundation in 2016
- Prometheus provides a multi-dimensional data model
- Time series identified by metric name and key/value pair
- It has a flexible query language you can use
- There is no distributed storage necessary
- Metric collection happens via a pull model over HTTP
- Push is also supported using a gateway
- Service Discovery supported
- Web UI (dashboard) with graphing capabilities
Installation
- Setup permissions for Prometheus
rbac.yml
apiVersion: rbac.authorization.k8s.io/v1beta1
kind: ClusterRole
metadata:
  name: prometheus-operator
rules:
- apiGroups:
  - extensions
  resources:
  - thirdpartyresources
  verbs:
  - "*"
- apiGroups:
  - apiextensions.k8s.io
  resources:
  - customresourcedefinitions
  verbs:
  - "*"
- apiGroups:
  - monitoring.coreos.com
  resources:
  #- alertmanagers
  - prometheuses
  - servicemonitors
  verbs:
  - "*"
- apiGroups:
  - apps
  resources:
  - statefulsets
  verbs: ["*"]
- apiGroups: [""]
  resources:
  - configmaps
  - secrets
  verbs: ["*"]
- apiGroups: [""]
  resources:
  - pods
  verbs: ["list", "delete"]
- apiGroups: [""]
  resources:
  - services
  - endpoints
  verbs: ["get", "create", "update"]
- apiGroups: [""]
  resources:
  - nodes
  verbs: ["list", "watch"]
- apiGroups: [""]
  resources:
  - namespaces
  verbs: ["list"]
---
apiVersion: v1
kind: ServiceAccount
metadata:
  name: prometheus-operator
---
apiVersion: v1
kind: ServiceAccount
metadata:
  name: prometheus
---
apiVersion: rbac.authorization.k8s.io/v1beta1
kind: ClusterRole
metadata:
  name: prometheus
rules:
- apiGroups: [""]
  resources:
  - nodes
  - services
  - endpoints
  - pods
  verbs: ["get", "list", "watch"]
- apiGroups: [""]
  resources:
  - configmaps
  verbs: ["get"]
- nonResourceURLs: ["/metrics"]
  verbs: ["get"]
---
apiVersion: rbac.authorization.k8s.io/v1beta1
kind: ClusterRoleBinding
metadata:
  name: prometheus
roleRef:
  apiGroup: rbac.authorization.k8s.io
  kind: ClusterRole
  name: prometheus
subjects:
- kind: ServiceAccount
  name: prometheus
  namespace: default
---
apiVersion: rbac.authorization.k8s.io/v1beta1
kind: ClusterRoleBinding
metadata:
  name: prometheus-operator
roleRef:
  apiGroup: rbac.authorization.k8s.io
  kind: ClusterRole
  name: prometheus-operator
subjects:
- kind: ServiceAccount
  name: prometheus-operator
  namespace: default
---
apiVersion: v1
kind: ServiceAccount
metadata:
  name: kube-state-metrics
---
apiVersion: rbac.authorization.k8s.io/v1beta1
kind: ClusterRole
metadata:
  name: kube-state-metrics
rules:
- apiGroups: [""]
  resources:
  - nodes
  - pods
  - resourcequotas
  verbs: ["list", "watch"]
- apiGroups: ["extensions"]
  resources:
  - daemonsets
  - deployments
  - replicasets
  verbs: ["list", "watch"]
---
apiVersion: rbac.authorization.k8s.io/v1beta1
kind: ClusterRoleBinding
metadata:
  name: kube-state-metrics
roleRef:
  apiGroup: rbac.authorization.k8s.io
  kind: ClusterRole
  name: kube-state-metrics
subjects:
- kind: ServiceAccount
  name: kube-state-metrics
  namespace: monitoring
kubectl create -f rbac.yml
- Deploy Prometheus
prometheus-resource.yml
apiVersion: monitoring.coreos.com/v1
kind: Prometheus
metadata:
  name: prometheus
  labels:
    prometheus: prometheus
spec:
  replicas: 2
  version: v1.7.0
  serviceAccountName: prometheus
  serviceMonitorSelector:
    matchExpressions:
    - {key: prometheus-enabled, operator: Exists}
  #ruleSelector:
  #  matchLabels:
  #    role: prometheus-rulefiles
  #    prometheus: k8s
  resources:
    requests:
      # 2Gi is default, but won't schedule if you don't have a node with >2Gi
      # memory. Modify based on your target and time-series count for
      # production use. This value is mainly meant for demonstration/testing
      # purposes.
      memory: 400Mi
  #alerting:
  #  alertmanagers:
  #  - namespace: monitoring
  #    name: alertmanager-main
  #    port: web
prometheus.yml
apiVersion: extensions/v1beta1
kind: Deployment
metadata:
  labels:
    k8s-app: prometheus-operator
  name: prometheus-operator
spec:
  replicas: 1
  template:
    metadata:
      labels:
        k8s-app: prometheus-operator
    spec:
      containers:
      - args:
        - --kubelet-service=kube-system/kubelet
        - --config-reloader-image=quay.io/coreos/configmap-reload:v0.0.1
        image: quay.io/coreos/prometheus-operator:v0.17.0
        name: prometheus-operator
        ports:
        - containerPort: 8080
          name: http
        resources:
          limits:
            cpu: 200m
            memory: 100Mi
          requests:
            cpu: 100m
            memory: 50Mi
      serviceAccountName: prometheus-operator
---
apiVersion: v1
kind: Service
metadata:
  name: prometheus
spec:
  type: LoadBalancer
  ports:
  - name: web
    port: 9090
    protocol: TCP
    targetPort: web
  selector:
    prometheus: prometheus
kubectl create -f prometheus.yml
kubectl create -f prometheus-resource.yml
- Deploy Kubernetes monitoring
kubernetes-monitoring.yml
apiVersion: v1
kind: Service
metadata:
  namespace: kube-system
  name: kube-scheduler-prometheus-discovery
  labels:
    k8s-app: kube-scheduler
    prometheus-enabled: "true"
spec:
  selector:
    k8s-app: kube-scheduler
  type: ClusterIP
  clusterIP: None
  ports:
  - name: http-metrics
    port: 10251
    targetPort: 10251
    protocol: TCP
---
apiVersion: v1
kind: Service
metadata:
  namespace: kube-system
  name: kube-controller-manager-prometheus-discovery
  labels:
    k8s-app: kube-controller-manager
    prometheus-enabled: "true"
spec:
  selector:
    k8s-app: kube-controller-manager
  type: ClusterIP
  clusterIP: None
  ports:
  - name: http-metrics
    port: 10252
    targetPort: 10252
    protocol: TCP
---
apiVersion: extensions/v1beta1
kind: DaemonSet
metadata:
  name: node-exporter
spec:
  template:
    metadata:
      labels:
        app: node-exporter
      name: node-exporter
    spec:
      hostNetwork: true
      hostPID: true
      containers:
      - image:  quay.io/prometheus/node-exporter:v0.14.0
        args:
        - "-collector.procfs=/host/proc"
        - "-collector.sysfs=/host/sys"
        name: node-exporter
        ports:
        - containerPort: 9100
          hostPort: 9100
          name: scrape
        resources:
          requests:
            memory: 30Mi
            cpu: 100m
          limits:
            memory: 50Mi
            cpu: 200m
        volumeMounts:
        - name: proc
          readOnly:  true
          mountPath: /host/proc
        - name: sys
          readOnly: true
          mountPath: /host/sys
      volumes:
      - name: proc
        hostPath:
          path: /proc
      - name: sys
        hostPath:
          path: /sys
---
apiVersion: v1
kind: Service
metadata:
  labels:
    app: node-exporter
    k8s-app: node-exporter
    prometheus-enabled: "true"
  name: node-exporter
spec:
  type: ClusterIP
  clusterIP: None
  ports:
  - name: http-metrics
    port: 9100
    protocol: TCP
  selector:
    app: node-exporter
---
apiVersion: extensions/v1beta1
kind: Deployment
metadata:
  name: kube-state-metrics
spec:
  replicas: 1
  template:
    metadata:
      labels:
        app: kube-state-metrics
    spec:
      serviceAccountName: kube-state-metrics
      containers:
      - name: kube-state-metrics
        image: quay.io/coreos/kube-state-metrics:v1.0.0
        ports:
        - name: metrics
          containerPort: 8080
        resources:
          requests:
            memory: 100Mi
            cpu: 100m
          limits:
            memory: 200Mi
            cpu: 200m
---
apiVersion: monitoring.coreos.com/v1
kind: ServiceMonitor
metadata:
  name: kube-apiserver
  labels:
    k8s-app: apiserver
    prometheus-enabled: "true"
spec:
  jobLabel: component
  selector:
    matchLabels:
      component: apiserver
      provider: kubernetes
  namespaceSelector:
    matchNames:
    - default
  endpoints:
  - port: https
    interval: 30s
    scheme: https
    tlsConfig:
      caFile: /var/run/secrets/kubernetes.io/serviceaccount/ca.crt
      serverName: kubernetes
    bearerTokenFile: /var/run/secrets/kubernetes.io/serviceaccount/token
---
apiVersion: monitoring.coreos.com/v1
kind: ServiceMonitor
metadata:
  name: kubelet
  labels:
    k8s-app: kubelet
    prometheus-enabled: "true"
spec:
  jobLabel: k8s-app
  endpoints:
  - port: http-metrics
    interval: 30s
  - port: cadvisor
    interval: 30s
    honorLabels: true
  selector:
    matchLabels:
      k8s-app: kubelet
  namespaceSelector:
    matchNames:
    - kube-system
---
apiVersion: monitoring.coreos.com/v1
kind: ServiceMonitor
metadata:
  name: kube-controller-manager
  labels:
    k8s-app: kube-controller-manager
    prometheus-enabled: "true"
spec:
  jobLabel: k8s-app
  endpoints:
  - port: http-metrics
    interval: 30s
  selector:
    matchLabels:
      k8s-app: kube-controller-manager
  namespaceSelector:
    matchNames:
    - kube-system
---
apiVersion: monitoring.coreos.com/v1
kind: ServiceMonitor
metadata:
  name: kube-scheduler
  labels:
    k8s-app: kube-scheduler
    prometheus-enabled: "true"
spec:
  jobLabel: k8s-app
  endpoints:
  - port: http-metrics
    interval: 30s
  selector:
    matchLabels:
      k8s-app: kube-scheduler
  namespaceSelector:
    matchNames:
    - kube-system
---
apiVersion: monitoring.coreos.com/v1
kind: ServiceMonitor
metadata:
  name: kube-state-metrics
  labels:
    k8s-app: kube-state-metrics
    prometheus-enabled: "true"
spec:
  jobLabel: k8s-app
  selector:
    matchLabels:
      k8s-app: kube-state-metrics
  namespaceSelector:
    matchNames:
    - monitoring
  endpoints:
  - port: http-metrics
    interval: 30s
    honorLabels: true
---
apiVersion: monitoring.coreos.com/v1
kind: ServiceMonitor
metadata:
  name: node-exporter
  labels:
    k8s-app: node-exporter
    prometheus-enabled: "true"
spec:
  jobLabel: k8s-app
  selector:
    matchLabels:
      k8s-app: node-exporter
  namespaceSelector:
    matchNames:
    - monitoring
  endpoints:
  - port: http-metrics
    interval: 30s
kubectl create -f kubernetes-monitoring.yml
- Deploy example application
example-app.yml
apiVersion: extensions/v1beta1
kind: Deployment
metadata:
  name: example-app
spec:
  replicas: 3
  template:
    metadata:
      labels:
        app: example-app
    spec:
      containers:
      - name: example-app
        image: fabxc/instrumented_app
        ports:
        - name: web
          containerPort: 8080
---
kind: Service
apiVersion: v1
metadata:
  name: example-app
  labels:
    app: example-app
    prometheus-enabled: "true"
spec:
  selector:
    app: example-app
  ports:
  - name: web
    port: 8080
---
apiVersion: monitoring.coreos.com/v1
kind: ServiceMonitor
metadata:
  name: example-app
  labels:
    team: frontend
    prometheus-enabled: "true"
spec:
  selector:
    matchLabels:
      app: example-app
  endpoints:
  - port: web